Horizontal Evaluation of Nutrition North Canada
Prepared by: Evaluation, Performance Measurement and Review Branch
January 2020
PDF Version (543 Kb, 31 Pages)
Table of contents
List of Acronyms
| CIRNAC: |
Crown-Indigenous Relations and Northern Affairs Canada |
|---|---|
| CPI: |
Consumer Price Index |
| FNIHB: |
First Nations and Inuit Health Branch |
| HC: |
Health Canada |
| INAC: |
Indigenous and Northern Affairs Canada |
| ISC: |
Indigenous Services Canada |
| NNC: |
Nutrition North Canada |
| O&M: |
Operation and Maintenance |
| PHAC: |
Public Health Agency of Canada |
| RNFB: |
Revised Northern Food Basket |
Executive Summary
In August 2017, the new departments of Crown-Indigenous Relations and Northern Affairs Canada (CIRNAC) and Indigenous Services Canada (ISC) were created to replace the former Indigenous and Northern Affairs Canada (INAC). The subsidy portion of the program was moved to CIRNAC and the Nutrition North Canada (NNC) nutrition education initiatives led by Health Canada - along with all other programs operated by the First Nations and Inuit Health Branch (FNIHB) were moved to ISC.
Field work for the Horizontal Evaluation of NNC was conducted by CIRNAC's Evaluation, Performance Measurement and Review Branch, with some economic analysis and site visit assistance provided by Prairie Research Associates. Comments on the methodology and the draft report were provided by the Assembly of First Nations and Inuit Tapiriit Kanatami, and internal staff from CIRNAC's Northern Affairs Organization, Health Canada's evaluation team, and ISC's FNIHB.
The evaluation examined the impacts and design of components related to Nutrition North Canada funded by the former INAC and the nutrition education initiatives funded by Health Canada from 2012-13 to 2017-18, and included 68 key-informant interviews, including 55 interviews with community administrators and retailers as part of site visits; an extensive literature review; a document and program file review; and analysis of data.
The evaluation assessed progress towards Government of Canada outcomes of strengthening the nutritional choices and overall health of isolated northern communities through the food subsidy and nutrition education initiatives. NNC represented approximately $360 million in federal spending between 2012-13 and 2017-18.
Generally speaking, this evaluation finds that the program is successful with giving residents in remote and northern communities more access to nutritious perishable food at a subsidized rate. It also finds that greater subsidy is associated with greater consumption of healthy foods. However, in its current design, while the program reduces and controls the prices of a select number of goods, a typical household of four is able to afford less than half of the contents of the Revised Northern Food Basket. Lower level subsidies to foods considered staples and in high demand offer minimal savings. Additionally, the program has limited tangible impact on the processing and shipment of country food (i.e. traditionally hunted and harvested food) in NNC‑eligible communities due to low uptake.
Importantly, communications efforts on the part of the Government of Canada have not necessarily resulted in higher awareness or understanding of NNC amongst the affected population.
A key success for NNC are the education initiatives funded through FNIHB. The growth in participation in community-based nutrition education initiatives demonstrates that more people are acquiring knowledge and skills to eat healthy. There is a higher demand for certain types of activities such as traditional food knowledge and skills and retail-based nutrition knowledge and awareness.
It is therefore recommended that CIRNAC:
- Work with communities and representatives of Indigenous peoples and governments to revise the eligible food list to be more relevant to local diets and needs;
- Work with communities and representatives of Indigenous peoples and governments on strategies to further reduce the price of nutritious foods;
- Develop indicators for program impact that look beyond the Revised Northern Food Basket relative to the Consumer Price Index;
- Examine potential new approaches to further improve access to nutritious foods for Northerners, especially for low-income families;
- Develop options to provide support to harvesters for supplies and tools to facilitate sharing of country food within communities, and pursue innovations for locally produced food; and
- Establish better communications with residents of eligible communities about NNC and how it works, especially the personal orders portion of the program.
It is recommended that ISC:
- Work with communities to disseminate information to better support nutrition education about healthy eating choices including healthy alternatives to fresh fruits and vegetables.
Management Response and Action Plan
Project Title: Evaluation of the Nutrition North Canada
Project #: 1570-7/16136
1. CIRNAC Management Response
This evaluation and the Department’s proposed Action Plan will help support and continue the dialogue the Department has undertaken with the Indigenous Working Group, the Inuit-Crown Food Security Working Group, Northerners, other levels of government and other stakeholders.
The overall objective of the Nutrition North Canada Program is to strengthen the nutritional choices and overall health of isolated northern communities by subsidizing foods and non-food items and aligning program spending to where it will have the greatest impact for Northerners.
The high cost of living and food security in the North remains a critical issue, one that significantly impacts the health and well-being of individuals, families and communities, and remains a multi-jurisdictional responsibility. As we heard in the Nutrition North Canada Engagement 2016 final report, many Northerners living in the isolated communities are confronted with increased costs and food prices while living on a fixed income. Addressing this important issue through leadership and collaboration from many sectors and stakeholders across government and non-governmental organizations is a main concern.
In order to help alleviate these and many other challenges that Northerners face, the Government of Canada is working towards a comprehensive Food Policy for Canada, an Arctic and Northern Policy Framework, and updates to the Nutrition North Canada Program.
The Evaluation of Nutrition North Canada and the attached Action Plan will help focus the program’s efforts on matters that are most meaningful to Northerners. This will be reflected in the development of policies and programming that is more attuned to the preferences of Northerners’ diets, cultures, traditions, customs and needs.
2. ISC Management Response
For the Evaluation of Nutrition North Canada, conducted by the Evaluation, Performance Measurement and Review Branch (former INAC), this Management Response and Action Plan addresses the recommendation specific to the nutrition education program component led by Indigenous Services Canada, First Nations and Inuit Health Branch (ISC-FNIHB) (which was under the responsibility of Health Canada until December 2017).
ISC recognizes the evaluation findings related to Nutrition North Canada Nutrition Education Initiatives, specifically:
- the nutrition education component led by Indigenous Services Canada is a key success of Nutrition North Canada;
- the growth in participation in community-based nutrition education initiatives demonstrates that more people are acquiring knowledge and skills for healthy eating; and
- there is a higher demand for certain types of activities, such as traditional food knowledge and skills, and retail-based nutrition knowledge and awareness.
The evaluation provides one recommendation related to Nutrition North Canada Nutrition Education Initiatives to support program delivery. ISC accepts this recommendation, and will strive to meet it by working through its existing mechanisms with partners at the regional and territorial levels, as in many cases ISC is the funder of services, rather than directly providing service to communities eligible for NNC. For example, the Government of Nunavut is the service provider in Nunavut. ISC will also at the same time continue to support self-determined approaches in the delivery of Nutrition North Canada Nutrition Education Initiatives, as per the ISC mandate. The Action Plan identifies the activities to meet the evaluation’s recommendation.
ISC intends to initiate implementation of the recommendation immediately. An annual review of the Management Response and Action Plan will be conducted by the ISC-Evaluation Division and shared with the ISC Performance Management and Evaluation Committee to monitor progress and activities.
The approach to immediately take action on this recommendation reconfirms the ongoing commitment from ISC to respond to community needs and support First Nations and Inuit communities with the design and delivery of their community-based nutrition education activities under Nutrition North Canada, in order to meet their local needs and priorities.
3. Action Plan
| Recommendations | Actions | Responsible Manager (Title / Sector) | Planned Start and Completion Dates |
|---|---|---|---|
| It is recommended that CIRNAC: | |||
| 1. Work with communities and representatives of Indigenous peoples and governments to revise the eligible food list to be more relevant to local diets and needs. | We concur. | Assistant Deputy Minister, Northern Affairs Organization | Start Date: |
| On January 1, 2019, Nutrition North Canada implemented a revised food list that was developed in consultation with Northerners. The Department continues to engage on this issue and meets regularly with the Nutrition North Canada Indigenous Working Group, the Inuit-Crown Food Security Working Group and the Nutrition North Canada Advisory Board to ensure that the list is still relevant and meets the cultural and dietary needs of Northerners. | Completion: |
||
| 2. Work with communities and representatives of Indigenous peoples and governments on strategies to further reduce the price of nutritious foods. | We concur. | Assistant Deputy Minister, Northern Affairs Organization | Start Date: |
| Nutrition North Canada continues to engage with the Indigenous Working Group, the Inuit-Crown Food Security Working Group and the Nutrition North Canada Advisory Board in order to ensure that the program is more responsive and relevant to Northerners. The program is introducing a surface transportation subsidy for sealift and winter roads as these are a better reflection of how Northerners resupply their community staples. Nutrition North Canada will work with the groups identified above to close the gap with respect to data quality for remote communities. | Completion: |
||
| 3. Develop indicators for program impact that look beyond the Revised Northern Food Basket relative to the Consumer Price Index. | We concur. | Assistant Deputy Minister, Northern Affairs Organization | Start Date: |
| The Department will work to develop indicators for program impact beyond the use of a comparison between Revised Northern Food Basket and the Consumer Price Index. As an example, the program will introduce the Northern Staple Goods List, which has been developed to monitor the price of eligible items subsidized when shipped by sealift or winter road. | Completion: |
||
| 4. Examine potential new approaches to further improve access to nutritious foods for Northerners, especially for low-income families. | We concur. | Assistant Deputy Minister, Northern Affairs Organization | Start Date: |
| The Department is examining the impact of the latest enhancements to the program to help inform the criteria that will better measure and contribute to results leading to improved access to nutritious foods for Northerners. The program enhancements to be examined include: increasing the subsidy levels in all communities; revising the Nutrition North Canada subsidy to remove the shipped by air restriction and including surface transportation; increasing air-lift subsidy rates in highest needs communities; and, introducing a new Harvesters Support Grant to off-set the cost of local traditional harvesting activities to better support access to country food. | Completion: |
||
| 5. Develop options to provide support to harvesters for supplies and tools to facilitate sharing of country food within communities, and pursue innovations for locally produced food. | We concur. | Assistant Deputy Minister, Northern Affairs Organization | Start Date: |
Nutrition North Canada is implementing a Harvesters Support Grant to help lower the high costs associated with traditional hunting and harvesting activities, and to increase efficiencies for the organizations delivering the grant. In addition, as part of the Government of Canada's Food Policy, Budget 2019 provided the Canadian Northern Economic Development Agency with $15 million, over five years, starting in 2019–20, to establish a Northern Isolated Community Initiatives Fund. This fund will support community-led projects for local and Indigenous food production systems. |
Completion: |
||
| 6. Establish better communications to residents of eligible communities about NNC and how it works, especially the personal orders portion of the program. | We concur. | Director General Communications | Start Date: |
| The program is developing a renewed and proactive Communications approach, in collaboration with CIRNAC's Communications Branch and Indigenous community partners, to inform residents of the latest changes to the program, and for their input on how to enhance program communications. In that vein, the program will also explore the possibility of retaining the services of a Communications Expert to develop a Strategy, and Nutrition North Canada will be conducting community outreach sessions to support this recommendation. Nutrition North Canada will also work closely with Privy Council Office's Impact and Innovation Unit to enhance its transparency measures. | Completion: |
||
| Recommendations | Actions | Responsible Manager (Title / Sector) | Planned Start and Completion Dates |
|---|---|---|---|
| It is recommended that ISC: | |||
| 7. Work with communities to disseminate information to better support nutrition education about healthy eating choices including healthy alternatives to fresh fruits and vegetables. | We concur. | Senior Assistant Deputy Minister, FNIHB, ISC Chief Medical Officer of Public Health and Executive Director, Office of Population and Public Health, FNIHB, ISC |
Start Date: |
ISC does not in all cases work directly with communities that are eligible for Nutrition North Canada in the delivery of NNC Nutrition Education Initiatives. Instead, ISC works with and provides funding to partners such as the territorial governments or First Nations and Inuit organizations, who in turn provide NNC Nutrition Education Initiatives to communities. Thus, to be precise, ISC will work with communities and partners at the regional and territorial levels to support nutrition education about healthy eating choices, including healthy alternatives to fresh fruits and vegetables. ISC intends to initiate action to implement the recommendation immediately. Starting in December 2019, ISC-FNIHB will:
Work with communities and partners to finalize and disseminate information by December 31, 2021. |
Completion: |
||
1. Introduction
1.1 Context
The Horizontal Evaluation of the Nutrition North Canada (NNC) Program was initiated as per the five-year evaluation plan, approved by the Deputy Minister of the former Indigenous and Northern Affairs Canada (INAC). In August 2017, the new departments of Crown-Indigenous Relations and Northern Affairs Canada (CIRNAC) and Indigenous Services Canada (ISC) were created to replace the former INAC. The subsidy portion of the program was moved to CIRNAC and the NNC nutrition education initiatives led by Health Canada - along with all other programs operated by the First Nations and Inuit Health Branch (FNIHB) were moved to ISC.
The evaluation was conducted by CIRNAC's Evaluation, Performance Measurement and Review Branch, with some economic analysis and site visit assistance provided by Prairie Research Associates. Comments on methodology and the draft report were provided by the Assembly of First Nations and Inuit Tapiriit Kanatami, and internal staff from CIRNAC's Northern Affairs Organization, Health Canada/Public Health Agency of Canada Office of Audit and Evaluation, and ISC's FNIHB supported the evaluation planning.
1.2 Methodology and Scope
The evaluation examined the impacts and design of NNC, including both the food subsidy component funded by CIRNAC (and formerly INAC) and the nutrition education initiatives funded by ISC (and formerly of Health Canada) from 2012-13 to 2017-18.
Methodology for this evaluation included 68 key-informant interviews, including 55 interviews with community administrators and retailers as part of site visits. Site visits were made to Cambridge Bay and Pangnirtung in Nunavut; Makkovik, Labrador; Pakua Shipi, Quebec; and Deline, Northwest Territories. Focus groups were held in each site visit with community members, but turnout was low, with a total of 19 participants. It also included a comprehensive review of 58 literatures sources, a document and program file review, and program data analysis.
Raw data held by CIRNAC was examined and informs many of the observations in this report. This data comprised shipping weights and subsidy amounts of food by type, by retailer, and by month, from 2013 to 2017. ISC provided summaries from the analyses of the nutrition education initiatives annual reporting completed by eligible funding recipients.
Another nutrition education component of the program, led by the Public Health Agency of Canada (PHAC), was not included within the scope of this evaluation as they only became a program partner starting in fiscal year 2016-17.
This report was also informed by a socio-economic analysis conducted by Prairie Research Associates Inc. for the project.
A detailed matrix of evaluation questions is found in Appendix A.
2. Overview of Nutrition North Canada
2.1 Background and Description
The NNC program was introduced in 2011 as an initiative to reduce the cost of nutritious, perishable foods in isolated northernFootnote 1 communities, and to better promote nutritious eating, replacing the Food Mail Program, which had operated since the late 1960s.
CIRNAC provides a subsidy directly to northern retailers, suppliers, and registered country food processors that apply, meet the program's requirements, and register with NNC by signing a funding agreement with CIRNAC.
Eligible Communities: In 2016, the Department revised the community eligibility criteria and received increased funding in order to expand the program to all isolated northern communities. As of October 1, 2016, there was a total of 121 communities across Alberta, Manitoba, Newfoundland and Labrador, Northwest Territories, Nunavut, Ontario, Quebec, Saskatchewan, and Yukon eligible for the subsidy.
Subsidy: Program guidelines stipulate that retailers and suppliers manage their own supply chain arrangements. Subsidy rates vary by community and are set in consideration of key cost drivers for food prices in isolated communities: distance to nearest supply centre, population size, minimum wage, and total flight distance.
In addition to eligible perishable, nutritious foods, NNC subsidizes country food or traditional foods (ex. arctic char, musk-ox, and caribou) that are commercially-processed in the North and shipped by air to eligible isolated northern communities. For each community, during the scope period of this evaluation (until 2018) there were two levels of subsidy: Level 1 (high) subsidy rate generally applies to the most nutritious and most perishable food; Level 2 (low) subsidy rate applies to all other eligible items.
NNC Nutrition Education Initiatives: Given that there are a number of factors that influence healthy eating patterns other than food cost, nutrition education initiatives were introduced as part of NNC to complement the food subsidy program component. ISC and PHAC provide funding and support to eligible communities for the delivery of retail and community-based nutrition education activities. This funding supports culturally appropriate retail and community-based activities that help to increase knowledge of healthy eating and develop skills in the selection and preparation of healthy store-bought and traditional or country food.
Communities decide which NNC nutrition education activities to undertake based on their needs and priorities. Examples of funded activities include promotion of healthy food knowledge and skills among children, youth and adults in schools and community-settings; in-store taste tests and grocery store tours; traditional food knowledge, harvesting and preparation; and partnerships and collaboration with other community programs. As part of the Budget 2016 commitments and the October 2016 program expansion, the newly added communities were also provided funding to support the delivery of the nutrition education component of NNC. Since FNIHB's mandate provides support specifically to First Nations and Inuit communities, PHAC joined the program as a partner to deliver NNC Nutrition Education Initiatives in the eligible communities that fell outside the mandate of FNIHB. In total, ISC funds and supports 111 eligible First Nations and Inuit communities. As funding nutrition education initiatives was new in 33 First Nation communities when this evaluation was undertaken, there was limited ability to fully assess outcomes.
Note that PHAC activities were not included in the scope of this evaluation.
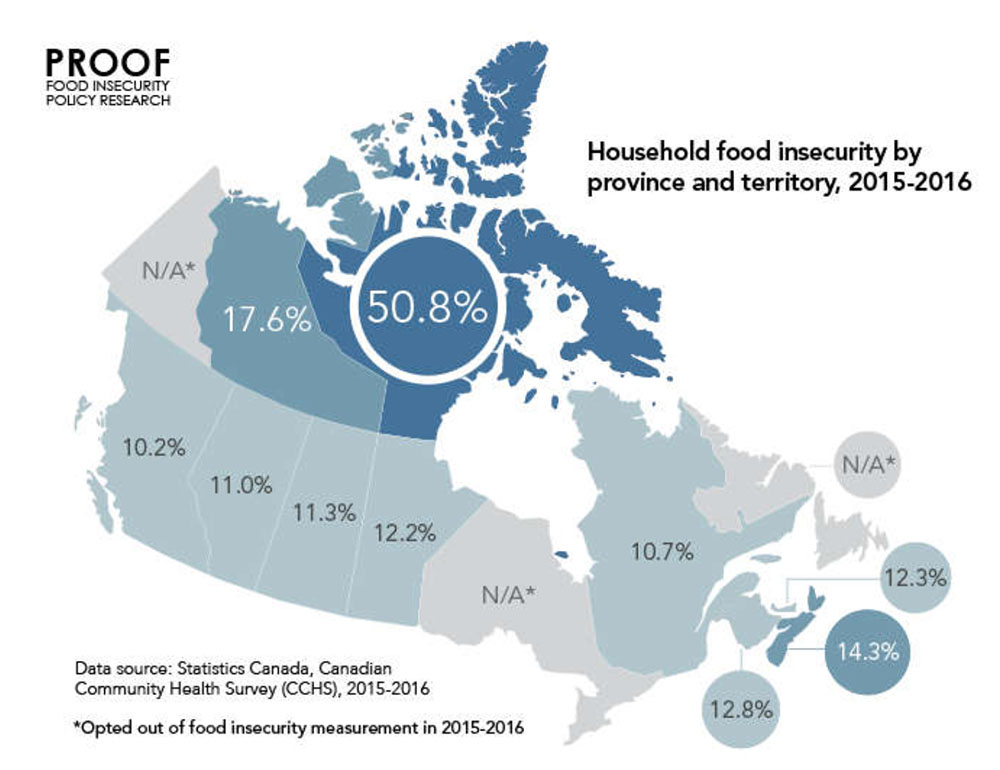
Provinces and territories experience different levels of food insecurityFootnote 2 that range from 10.2 percent in British Columbia to 50.8 percent in Nunavut (Figure 1).
While not designed as a food security program per se, NNC strives to address some of the aspects contributing to food insecurity, namely by reducing the high costs of nutritious perishable foods to make them more affordable than they would otherwise be for residents of eligible isolated northern communities without year-round surface (road, rail or marine) access. The definition of affordability is paramount, as there is an implicit assumption that price reduction will make foods more affordable.
Figure 1: Food insecurity in Canada
Description of Figure 1: Food insecurity in Canada
Figure 1 is a map of Canada that illustrates household food insecurity by province and territory in 2015/2016. The data demonstrates the following:
In the Yukon, the data was not available. In the Northwest Territories, 17.6 percent of households were food insecure. In Nunavut, 50.8 percent of households were food insecure. In British Columbia, 10.2 percent of households were food insecure. In Alberta, 11.0 percent of households were food insecure. In Saskatchewan, 11.3 percent of households were food insecure. In Manitoba, 12.2 percent of households were food insecure. In Ontario, the data was not available. In Québec, 10.7 percent of households were food insecure. In New Brunswick, 12.8 percent of households were food insecure. In Nova Scotia, 14.3 percent of households were food insecure. In Prince Edward Island, 12.3 percent of households were food insecure. In Newfoundland, the data was not available.
This information comes from the Statistics Canada, Canadian Community Health Survey (CCHS), 2015-16.
It is important to note that many of the factors that affect the accessibility of food in the North are beyond the control of a food subsidy program like the NNC program. High food prices in the North are due to factors such as the lack of competition, lack of economies of scale, reduced number of modes of transportation, and harsh climate. Ultimately, poverty is the main driver of food insecurity among Inuit and other populations. As a result, the consumption of less healthy and cheaper non-perishable items is higher, which significantly affects population health in these communities.
2.2 Objectives and Expected Outcomes
According to the INAC 2017-18 Departmental Plan, the expected result of NNC is that "residents in eligible communities have access to nutritious perishable food at a subsidized rate."" This is assessed by measuring the extent to which the subsidy is passed to consumers, retailers showing savings on till receipts, and the annual percentage variation in the quantity of subsidized items shipped by air. The ultimate outcome of the program is to "strengthen the nutritional choices and overall health of isolated northern communities through the food subsidy… and the targeted nutrition education initiatives…" While food security issues are often cited by partners and stakeholders as a major issue when discussing NNC, the Government does not currently consider this a target outcome of the subsidy.
2.3 Program Resources
Over the five years of study in this evaluation, total funding from what was then INAC (now administered by CIRNAC) and the education components of Health Canada (HC) (now administered by ISC) increased from approximately $68 million in 2012-13 to $83 million in 2017-18 (see Table 1).
| Activities | Financial resources | ||
|---|---|---|---|
| Vote 1 and Statutory | Vote 10 | Total | |
| 2012-2013 | |||
| INAC component | 2,808,508 | 62,317,423 | 65,125,931 |
| HC component | 342,828 | 2,552,043 | 2,894,871 |
| Sub-total | 3,151,336 | 64,869,466 | 68,020,802 |
| 2013-2014 | |||
| INAC component | 2,355,533 | 63,879,237 | 66,234,770 |
| HC component | 342,828 | 2,552,043 | 2,894,871 |
| Sub-total | 2,698,361 | 66,431,280 | 69,129,641 |
| 2014-2015 | |||
| INAC component | 2,151,948 | 65,499,766 | 67,651,714 |
| HC component | 342,828 | 2,552,043 | 2,894,871 |
| Sub-total | 2,494,776 | 68,051,809 | 70,546,585 |
| 2015-2016 | |||
| INAC component | 1,999,411 | 68,498,325 | 70,497,736 |
| HC component | 342,828 | 2,552,043 | 2,894,871 |
| Sub-total | 2,342,239 | 71,050,368 | 73,392,607 |
| 2016-2017 | |||
| INAC component | 2,541,840 | 71,871,143 | 74,412,983 |
| HC component | 657,405 | 3,657,543 | 4,314,948 |
| Sub-total | 3,199,245 | 75,528,686 | 78,727,931 |
| 2017-2018 | |||
| INAC component | 1,902,624 | 77,487,000 | 79,389,624 |
| HC component | Not AvailableFootnote 3 | 3,657,106 | 3,657,106 |
| Sub-total | 1,902,624 | 81,144,106 | 83,046,730 |
| TOTAL | |||
| INAC component | 13,759,864 | 409,552,894 | 423,312,758 |
| HC component | 2,028,717 | 17,522,821 | 19,551,538 |
| Total | 15,788,581 | 427,075,715 | 442,864,296 |
3. Findings
3.1 Affordability
Finding 1. In its current design, NNC reduces the prices of a select number of goods through the food subsidy. This is considered to be a measure of affordability for the purpose of departmental performance, but ultimately omits consumer purchasing capacity, which indicates a typical household of four is able to afford less than half of the contents of the Revised Northern Food Basket. Economic factors, not the subsidy, most directly impact true affordability.
Finding 2. Foods from Level 2 are subsidized at a lower rate and offer minimal savings. Certain items from this category are considered staples across NNC communities and are in high demand among residents.
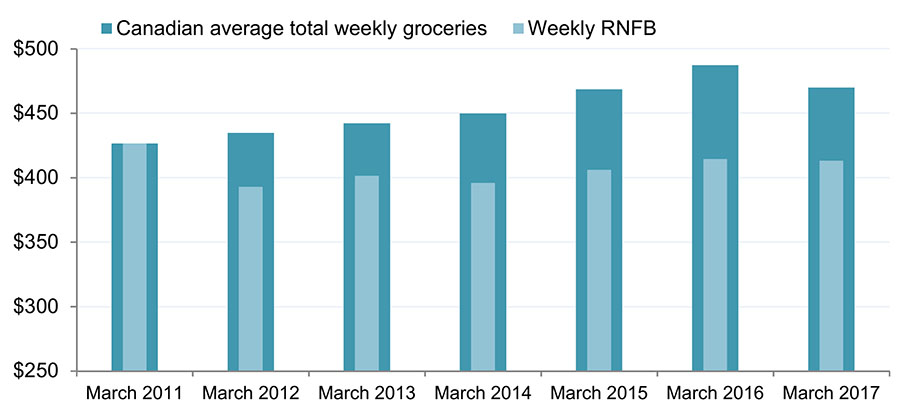
According to the program documentation, affordability is defined as a trend of the Revised Northern Food Basket (RNFB)Footnote 4 that stays at or below the annual trend for the Consumer Price Index (CPI) basket for food based on the 2010-2011 baseline year. In its current design, the program is achieving its outcome as it maintains the price of the RNFB at or below the Canadian average total weekly grocery cost for a family of four as estimated by the CPI basket for food (Figure 2)Footnote 5. Given that the RNFB contains very select items, the cost of the RNFB is not reflective of the weekly cost of groceries. Therefore, this comparison is not a true reflection of affordability.
The program’s definition of affordability does not take into account actual purchasing capacity, which if included, would be a more accurate and relevant definition of affordability, as level of income is the strongest predictor of affordability. The evaluation team used information from Statistics Canada to approximate a reasonable proportion of household disposable income to be spent on food. Between 2011 and 2016, the average Canadian household spent approximately 14.3 percent of disposable income on food. Since the RNFB represents a nutritious diet for a family of four, a man and a woman aged between 31 and 50, and a boy and a girl aged between 9 and 13, the median income used is for a couple with two children.
Figure 2: Canadian average weekly total groceriesFootnote 6 cost compared to weekly cost of RNFB
Description of Figure 2: Canadian average weekly total groceries cost compared to weekly cost of RNFB
Figure 2 is a bar graph that shows the Canadian average weekly total spent on groceries in comparison to the weekly cost of the Revised Northern Food Basket (RNFB).
In March 2011, the RNFB average and the average weekly total were both $426. In March 2012, the RNFB average was $393 and the average weekly total for household groceries was $435. In March 2013, the RNFB average was $402 and the average weekly total for household groceries was $442. In March 2014, the RNFB average was $396 and the average weekly total for household groceries was $450. In March 2015, the RNFB average was $406 and the average weekly total for household groceries was $469. In March 2016, the RNFB average was $415 and the average weekly total for household groceries was $487. In March 2017, the RNFB average was $413 and the average weekly total for household groceries was $470.
This information comes from Statistics Canada Estimates.
For the analysis below in Figure 3, the 14.3 percent figure referenced above is used to roughly estimate the dollar amount that a family of four making the median income for a given region could reasonably spend on food. Presumably, given the cost of the RNFB only comprises a proportion of the total cost of groceries, this estimate would overestimate purchasing power of a typical family in the North. But for the purpose of illustration, if we equate the weekly cost of the RNFB with the weekly cost of groceries, 14.3 percent of disposable income for a family of four making the median income equates to just being able to afford 40 percent of the contents of the RNFB. This does not account for other essential purchases not included in the RNFB.
For half of these households in the North, they can afford less than that. As shown in Figure 3 below, for example, very low income families (earning between $10,000 and $20,000 a year – about five percent of all families of four in the North) could only afford between six and 13 percent of the RNFB using this analysis.
The introduction of the Canada Child Benefit was largely intended to mitigate the costs of raising a family, particularly for low income families. Factoring in the calculated federal benefits available to tax filers, including the Canada Child Benefit, this affordability figure increases by about 10 percent for lower income earners, and by about five percent for average income earners (Figure 3).
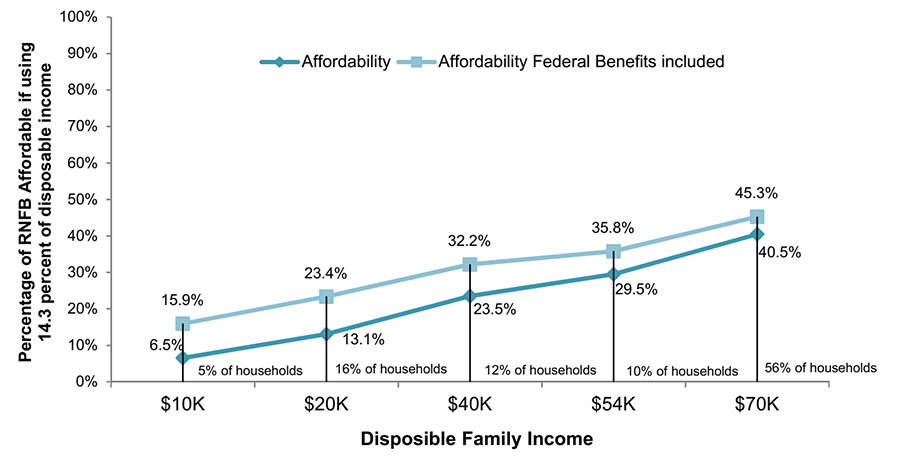
Description of Figure 3: Proportion of the contents of the RNFB considered "affordable" by median household income level for family of four
Figure 3 is a line graph that shows the proportion of the contents of the Revised Northern Food Basket (RNFB) considered "affordable" by median household income for a family of four. This graph uses the average Canadian household expenditure of 14.3 percent of income on food as the baseline.
The first data set shows that for a household with an annual income between $10,000 and $20,000 (which is about five percent of all families in the North), they could only afford between six and 13 percent of the RNFB.
The second data set shows that for a household with an annual income between $20,000 and $40,000 (which is about 16 percent of all families in the North), they were able to afford between 13.1 percent and 23.4 percent of the RNFB.
The third data set shows that for a household with an annual income between $40,000 and $54,000 (which represents 12 percent of all families in the North), they were able to afford between 23.5 percent and 32.2 percent of the RNFB.
The fourth data set shows that for a household with an annual income between $54,000 and $70,000 (which represents 10 percent of all families in the North), they were able to afford between 29.5 percent and 35.8 percent of the RNFB.
The fifth and final data set shows that for a household with an annual income over $70,000 (which represents 56 percent of all families in the North), they were able to afford between 40.5 percent and 45.3 percent of the RNFB.
While there is some agreement in the communities visited by the evaluation team that the NNC subsidy is somewhat helping with food prices, the general consensus is that the subsidy is having minimal impact on affordability, especially for lower income earners.
Those residents most affected by unaffordable food include seniors, individuals and families relying on income assistance, or those with minimum wage, seasonal, and/or part-time employment. Also affected are those families where only one member of a large extended family is working and has responsibilities to support other family members.
The socio-economic data analysis compiled by the evaluators demonstrated that affordability is driven by the economic strength (participation and income) of the community, and not by the subsidy. In other words, while prices are reduced by the subsidy, affordability is not necessarily strengthened by it, as when controlling for economic variables, the effect of the subsidy on how much a family can afford essentially becomes nil.Footnote 7 Additionally, the subsidy focusses on the price of food and not the economic realities or educational background of families or individuals. This economic reality is illustrated in Table 2.
| Labour force statistics | Average | Low | High | Canadian Average |
|---|---|---|---|---|
| Employment rate | 46% | 23% | 78% | 61% |
| Participation rateFootnote 8 | 58% | 30% | 83% | 66% |
| Unemployment rate | 20% | 0% | 47% | 8% |
| Median household income | $55,076 | $16,494 | $119,408 | $76,000 |
Further, certain foods are staples in the North, such as flour and lard. However, they are valued as less nutritious as per NNC given that they are subsidized at the Level 2 rate, which is almost negligible in terms of cost savings. These staple items are essential ingredients of bannock and bread, which are often taken by hunters on the land. Moreover, the minimal savings offered by the subsidy are often perceived negatively by residents.
Barges, sealifts and winter roads often provide considerable relief, as retailers can bring shelf-stable items and store them for a long time. However, this is only the case for communities where these modes of transportation are available for longer periods of time. Out of 111 communities, 76 percent are isolated for nine months or longer where the stock of shelf stable items does not last throughout the whole year. Conversely, 24 percent of communities are isolated for only two to eight months of the year and shelf-stable items brought by cheaper means of transportation do not have to be delivered by air. Therefore, consideration should be given to how such staples are subsidized as well as more consideration of aligning the foods subsidized to the community staples.
Residents look for more cost-effective ways to purchase food and other necessities. Some community members will make large bulk orders that are delivered by sealift during the short summer months when boats and barges can access the community or take advantage of when they travel to stock up on purchases from southern retailers. Residents seldom make use of the NNC option for direct or personal orders, which account for three percent of all NNC food shipped, and many are unaware of this option. However, communities acknowledge that such options are mostly available to residents with credit cards or bank accounts and access to sufficient funds to pay for large orders, as well as access to sufficient freezer and storage space in their homes.
Those community members without the ability to take advantage of the above options have to find other ways to make their available funds work to cover food and other living expenses. Options most commonly include purchasing food items that are less expensive than perishable nutritious foods, such as more reliance on canned foods, boxed items, prepared foods, and less nutritious packaged snack foods. The lack of knowledge about personal orders is tied to the general lack of awareness and understanding of the details of the NNC subsidy. There is an insufficient understanding of how the subsidy works, which foods are subsidized, the amount of the subsidy, and that there are two levels of subsidy.
Given these findings on affordability, it is recommended that CIRNAC:
- Work with communities and representatives of Indigenous peoples and governments to revise the eligible food list to be more relevant to local diets and needs;
- Work with communities and representatives of Indigenous peoples and governments on strategies to further reduce the price of nutritious foods; and
- Develop indicators for program impact that look beyond the Revised Northern Food Basket relative to the Consumer Price Index.
3.2 Accessibility
Finding 3. Residents in NNC-eligible communities have access to nutritious perishable food at a subsidized rate, and greater subsidy is associated with greater consumption of healthy foods.
Finding 4. The program has limited tangible impact on the processing and shipment of country food (i.e. traditionally hunted and harvested food) in NNC-eligible communities due to low uptake.
All Foods Shipped
Access is not well-defined in the context of NNC objectives; however, it appears the objective of access is simply defined as the availability (physical presence) of nutritious perishable food in eligible communities at a subsidized rate. Defined this way, the program makes food more accessible. While NNC’s key measure of accessibility (total weight of subsidized foods shipped) has increased by 22 percent between 2012 and 2017, the weight shipped per capita has increased by about eight percent. This suggests that much of the increase may be due to steady population growth, but also suggests per capita consumption of items from the RNFB is increasing.
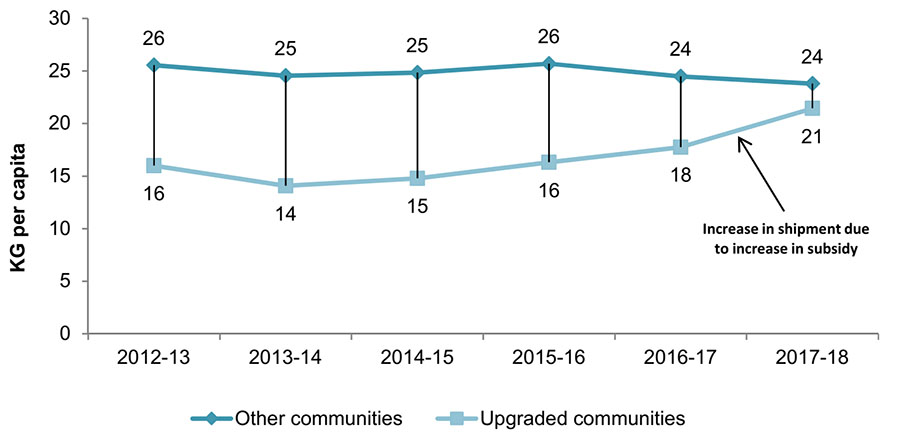
Further, the amount of subsidy is shown to be directly related to consumption. As shown in Figure 4, in the 12 communities that moved from partial to full subsidy in October 2016, there was a marked increase in the per capita amount of subsidized food shipped, bringing it almost to the same level as the communities that had full subsidy since the introduction of the program.
Figure 4: Kilogram per capita of food shipped over time between communities receiving partial subsidy before Oct 2016 then moving to full subsidy, compared to all other communities with full subsidy
Description of Figure 4: Kilogram per capita of food shipped over time between communities receiving partial subsidy before Oct 2016 then moving to full subsidy, compared to all other communities with full subsidy
Figure 4 is a line graph that illustrates the kilogram per capita of food shipped over time between communities receiving partial subsidy before October 2016 then moving to full subsidy, compared to all other communities with full subsidy. In 2012-13, twelve communities received a partial subsidy. In 2012-13, those communities received 16 kilograms of food per capita. In 2013-14, they received 14 kilograms of food per capita. In 2014-15, they received 15 kilograms of food per capita. In 2015-16, they began receiving a full subsidy and they moved to 16 kilograms of food per capita. In 2016-17, with a full subsidy the twelve communities received 18 kilograms of food per capita. In 2017-18, it increased again and the twelve communities received 21 kilograms of food per capita.
A second line of the graph illustrates that other communities that were already receiving a full subsidy received 26 kilograms of food per capita in 2012-13. In 2013-14, these other communities received 25 kilograms of food per capita. In 2014-15, they again received 25 kilograms of food per capita. In 2015-16, they received 26 kilograms of food per capita. In 2016-17, they received 24 kilograms of food per capita. In 2017-18, they again received 24 kilograms of food per capita.
This figure illustrates that once the subsidy was put in place the twelve communities who began to receive it, closed the gap with other communities to a difference of only 24 kilograms of food per capita compared to 21 kilograms of food per capita by 2017-18.
Community Initiatives to Improve Food Access
Communities have a myriad of approaches that they use to address food insecurity, both using NNC nutrition education funding as well as other approaches independent of NNC. In Pakua Shipi, for example, there is a food basket initiative that operates during winter months and provides families with a range of healthy fruits and vegetables in order to introduce them to foods that were not traditionally part of the Innu diet. The collective kitchen activities then has staff going into homes, providing recipes that make use of the ingredients, and showing family members how to cook with the ingredients using the recipes.
As another example, in Deline the local government launched a needs-based food voucher initiative that provides persons with low income with community food vouchers. These vouchers can be exchanged only for healthy foods at the grocery store.
In both of these examples, participants noted that these initiatives, while important, were not enough to address food security problems.
It is therefore recommended that CIRNAC:
- Examine potential new approaches to further improve access to nutritious foods for Northerners, especially for low-income families.
Country Food
Data on country foods suggests that the per capita amount shipped averages out to about 72 grams per year per person, and it is decreasing over time. There are several contributing factors to its low uptake by prospective food processors.
First, commercial processing of country food is constrained by frameworks established by the Canadian Food Inspection Agency, which makes it difficult for existing food processing facilities in the North to be eligible to process subsidized country food. One of the requirements, for example, is for the facility to have a paved entrance. Currently only two food processing facilities, in Rankin Inlet and Cambridge Bay, are federally licensed facilities and are registered with NNC.
Second, the interest in commercial processing may be low given the general practice of sharing country food that is commonplace in northern communities.
Third, there are market-based variations in how food processing in the North can benefit communities. Certain airlines, for example, offer free shipping of country food within regions, which further lessens the relevance or need of the NNC subsidy. In other communities, food processing facilities are connected with international markets to export harvested food, usually fish. These processing plants are not eligible to become processing facilities approved by NNC, but instead are geared toward export. Even if the eligibility criteria for NNC country food processing facilities became less stringent, there would still be a consideration of priority between export and internal supply.
Finally, migratory patterns and climate change negatively affect the availability of country food.
Residents in NNC-eligible communities should be more empowered to be custodians of their land and to pass traditional knowledge through generations. The evaluation team noted consensus among interviewees that support to harvesters for supplies and tools would be more beneficial than the existing structure of the NNC country food subsidy.
For northern residents, country food is a way to ensure self-sustainability to preserve their unique way of life. Communities also showed an interest in finding alternative ways to help the community become more self-sustainable with respect to nutritious perishable foods, with greenhouses viewed as the most feasible option. A few communities have tried community gardens but acknowledge that the short growing seasons present challenges. While challenges also exist with operating greenhouses in the North, particularly during the dark winter months and with the high heating costs, there is some optimism that greenhouses will become a more viable option with continued technological advances.
It is therefore recommended that CIRNAC:
- Develop options to provide support to harvesters for supplies and tools to facilitate sharing of country food within communities, and pursue innovations for locally produced food.
3.3 Impact on the Food Supply Chain
The introduction of the NNC program in 2011 had varying effects on the food supply chain in the North. There is a myriad of factors that drive grocery retail costs and affect the overall grocery supply chain environment in the North. The multitude and complexity of these factors, as well as a relatively recent introduction of the program, are such that it was impossible to quantify through a socio-economic analysis the exact impact, if any, of the NNC program on food retailing in the North. The information presented in this section is drawn from key informant interviews and site visits.
The market in the North is different from that in the South. It is not a competitive market in which a high number of suppliers in competition with each other reduce the price of goods offered, but rather a triopoly in which three large retailers have the biggest share of the market (or for that matter, a monopoly in smaller communities with just one retailer).
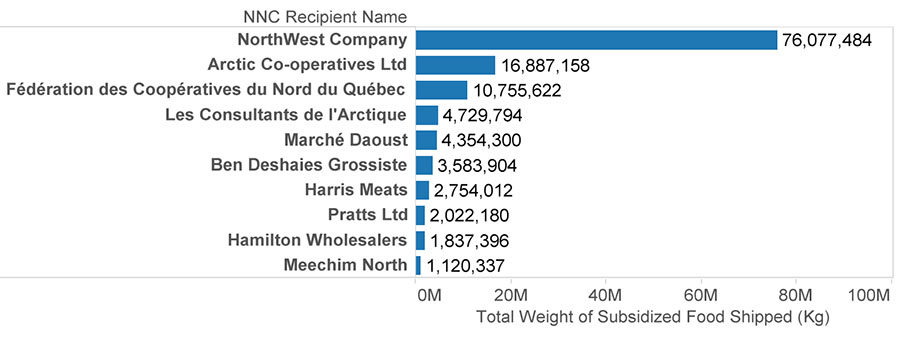
There are 59 distinct suppliers listed in the shipping database provided by NNC. However, the amount of NNC-subsidized food shipped is dominated by a small number of suppliers. Figure 5 lists the top ten suppliers by the volume of NNC-subsidized food shipped. As shown, North West Company ships over four times as much NNC-subsidized food as the next largest suppliers, Arctic Co-operatives Ltd. and Fédération des Coopératives du Nord du Québec, all combined.
Figure 5: Retailers receiving NNC Subsidies and Total weight of subsidized food shipped
Description of Figure 5: Retailers receiving NNC Subsidies and Total weight of subsidized food shipped
Figure 5 is a horizontal bar graph that compares the top ten retailers who receive a Nutrition North Canada (NNC) subsidy by the total weight of subsidized food they ship. First is the North West Company who ships 75,077,484 kilograms of food. Second is the Arctic Co-operatives Ltd. who ships 16,877,158 kilograms of food. Third is the Fédération des Coopératives du Nord du Québec who ships 10,755,622 kilograms of food. Fourth is Les Consultants de l’Artique who ships 4,729,794 kilograms of food. Fifth is Marché Daoust who ships 4,354,300 kilograms of food. Sixth is Ben Deshales Grossiste who ships 3,583,904 kilograms of food. Seventh is Harris Meats who ships 42,754,012 kilograms of food. Eighth is Pratts Ltd who ships 2,022,180 kilograms of food. Ninth is Hamilton Wholesalers who ships 1,837,396 kilograms of food. Last on the list is Meechim North who ships 1,120,337 kilograms of food.
Transportation is a significant factor that differentiates grocery retailing between North and South. In the North, grocery retailers are responsible for the transportation of their product and merchandise to their store. In the South, the supplier assumes these costs. With the introduction of the NNC program, certain retailers saw fewer problems in the warehouse, inspections, delays, as well as spoilage and waste. The retailers that were interviewed as part of this evaluation attributed these positive changes to the fact that they can now negotiate better freight rates which was not possible with Canada Post. This does not hold true for all retail locations as certain communities are serviced by two airlines with only one that can handle the freight requirements (for example, Pangnirtung, Nunavut). In practice, retailers in these communities are beholden to one airline.
However, overall, airlines have more flexibility with NNC in terms of their freight arrangements. They are allowed to group and ship subsidized and non-subsidized items together, which helps increase the longevity of certain items. Frozen foods, when grouped together, maintain the overall temperature, thus preventing them from thawing. This is especially good for consumers if nutrition education initiatives also happen to increase the demand for these foods as healthy food options and alternatives to fresh produce.
Retailers have to choose how much they want to pay to have their freight shipped in order to be able to take full advantage of this flexibility. They can pay more for higher service standards with the additional costs being reflected in the price of the final product.
Retailers have also reported a higher flexibility in terms of their routes. Northern communities are dispersed, which prevents retailers from taking advantage of higher volume shipment and automation. Moreover, before the NNC program was introduced, retailers had minimal control of the routing for their cargo with Canada Post being in charge of the main routing process. Under NNC, retailers have greater control of supply chains and choose the preferred routing system based on their business model and available shipping options.
3.4 Communication and Awareness
Finding 5. Communications efforts on the part of the Government of Canada have not necessarily resulted in higher awareness or understanding of NNC amongst the affected population.
NNC was created as a measure to alleviate certain factors that contribute to a very complex and sensitive issue – food insecurity in isolated northern communities. More specifically, the NNC program’s objectives are to reduce the cost of nutritious, perishable foods in isolated northernFootnote 9 communities, and to better promote nutritious eating. CIRNAC provides a subsidy directly to northern retailers, suppliers, and registered country food processors that apply, meet the program’s requirements, and register with NNC by signing a funding agreement with CIRNAC.
This evaluation found that beyond the general knowledge that some foods are subsidised, the details of the NNC subsidy are not well-known amongst the population. Most participants said it is not clear to them and other members of their community how the subsidy works, or which foods are subsidized. Few participants knew of the option to make direct or personal orders, and none were aware that there is some subsidization available for country food. Those participants that were aware of the NNC subsidy obtained their information primarily through the news and social media, or from information available in the stores. Information obtained through the news and social media can be negative, affecting public perceptions.
The communities visited for this evaluation had somewhat varying views on the extent that the subsidy has had an impact on prices. Skepticism appeared to be particularly high in the two Nunavut communities visited where many believe that consumers are not receiving the full subsidy, with a perception that retailers and, to some extent, airlines, are benefiting the most from the subsidy. Although other communities did not express this same belief, there was a reported limited awareness of how the subsidy works.
Better communication and information strategies are essential to ease the sense of distrust between NNC community residents, retailers, and government. Better communication will also allow residents to take full advantage of the NNC program, especially for personal orders.
The NNC program has strengthened its communications since the 2013 Evaluation and the 2014 Audit by the Auditor General of Canada. The implementation of a point-of-sale system was made mandatory for NNC retailers across the North as of April 1, 2016. This system ensures that customers can clearly see on their grocery receipt how and when the NNC subsidy is applied when shopping in stores managed by registered NNC retailers. Moreover, NNC retailers are required to advertise the program through in-store posters and shelf signage. It should be noted, however, that at the time of this evaluation, none of the Nunatsiavut communities had a point-of-sale system with this functionality.
However, due to the recent introduction of these requirements, the implementation of better advertisement measures varies by retailer. The larger northern stores appear to have the most information available, with those visited displaying, for example, an NNC poster, information on subsidy savings on the receipts, shelf stickers indicating which foods are subsidized, and some larger shelf labels that provide more detailed NNC savings information for some items. The Northwest company stores generally have posters available and information on the receipts. Unregistered retailers that order their food from registered southern suppliers have little to no information on the NNC subsidy available in the store.
Those communities that had some information on subsidy savings provided in the store and/or on store receipts did seem to have a somewhat better awareness of the availability of the subsidy and had stronger perceptions on the savings (or lack of savings) due to the subsidy. Those shoppers that study their receipts seemed to be generally impressed by the savings on the Level 1 subsidy. This effect is concurrent with the program strategy that maintains that heavier, more nutritious items are meant to provide greater savings and further incentivize residents to purchase these foods which eventually will lead to a behavioral change. However, without proper communications, this message is lost and residents are generally confused by the list of subsidized food and why they were chosen by NNC.
The types of communications matter greatly. Many community members appear to derive little information from the posters or the receipts. Many had not noticed the posters, or were not aware of the meaning of the information on the store receipts. Plus, other than the posters, all information provided is only English, presenting barriers to non-English-speaking community members. Moreover, there still remain a great number of residents who do not look at their receipts.
Communities all suggested that some type of visual or oral format would be the most effective means to communicate information on the NNC subsidy. Visual could include flyers and posters with pictorial aids, while oral could include, for example, presentations on radio or television or at community gatherings and events where information could be shared. It was also stressed that efforts need to be made to present any oral or any written communications in the language of the community. Certain retailers have made progress in this regard and reported positive results. For example, in Deline, the Northern Store implemented in-store signage in North Slavey, and Fédération des Coopératives du Nord du Québec offers services and information in Inuktitut.
It is therefore recommended that CIRNAC:
- Establish better communications with residents of eligible communities about NNC and how it works, especially the personal orders portion of the program.
3.5 Knowledge and Skills: FNIHB ISC Nutrition Education Initiatives
Finding 6. The growth in participation in community nutrition education initiatives demonstrates that more people are acquiring knowledge and skills for healthy eating.
Finding 7. There is a higher demand for certain types of activities such as traditional food knowledge and skills and retail-based nutrition knowledge and awareness.
The presence of nutritious perishable food at a reasonable price in stores does not necessarily mean it is purchased by consumers. The nutrition education initiatives aim to increase knowledge of healthy eating and develop skills for the selection and preparation of healthy foods including such activities as: promoting healthy food choices as part of healthy eating, introducing new foods and ways to prepare them, helping integrate country food, and giving people access to free food samples, in-store demonstrations, and cooking classes to provide them the opportunity to try new choices.
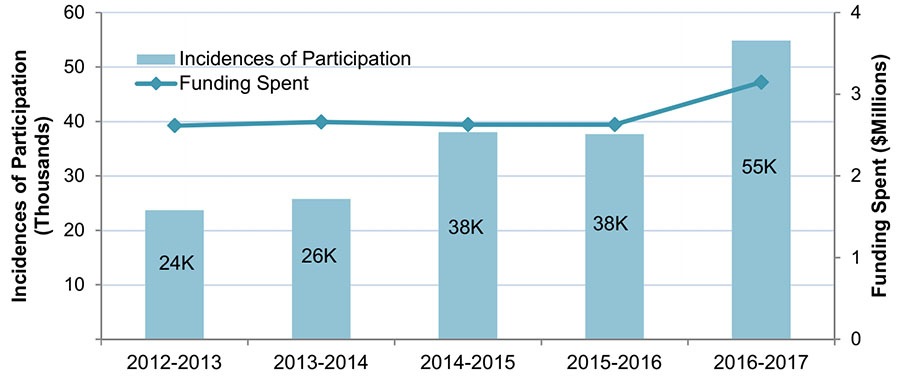
The nature of nutrition education initiatives funding, data gathering, and reporting, makes it difficult to attribute particular results of nutrition education initiatives to the NNC program. However, the growing incidences of participation seems to suggest that more people are interested in healthy eating and it is reasonable to expect that this will result in participants acquiring knowledge and skills to eat healthy. It is also clear that there is a relationship between the program funding and the extent of participation, as this increased investment expanded education initiatives to more communities (Figure 6).
The nutrition education initiatives received positive feedback during the evaluation site visits and the 2016 departmental engagements on NNC. Participants interviewed in all communities visited for this evaluation said there is a growing awareness of nutrition, the importance of eating healthy foods, living healthy and active lifestyles, and that many community members are making efforts to eat healthy. Some retailers have also noticed an increased interest in purchasing healthy nutritious foods such as fresh fruit and vegetables.
Figure 6: Incidences of Participation Relative to Funds Spent on Nutrition Education Initiatives Funded by NNC between 2012-13 and 2016-17Footnote 10
Description of Figure 6: Incidences of Participation Relative to Funds Spent on Nutrition Education Initiatives Funded by NNC between 2012-13 and 2016-17
Figure 6 is a mixed line and bar graph that compares the incidences of participation relative to funds spent on nutrition education initiatives funded by Nutrition North Canada (NNC) between 2012-13 and 2016-17.
In 2012-13, the NNC program spent $2,614,280 and had 24,000 participants. In 2013-14, the NNC program spent $2,659,880 and had 26,000 9participants. In 2014-15, the NNC program spent $2,626,323 and had 38,000 participants. In 2015-16, the NNC program again spent $2,626,323 and had 38,000 participants. In 2016-17, the NNC program spent $3,145,573 and had 55,000 participants.
The NNC nutrition education initiatives are flexible and allow communities to choose the types of activities that serve their needs and preferences. Additionally, nutrition education and cooking classes often involve meal preparation and participants either eat in class or take the food home. Participants in site visits and key informant interviews indicated that the design of nutrition education initiatives was effective.
The funding model is not the same in all NNC communities. In some cases the funding is provided directly to individual communities, while in other cases the funding is provided to other governments (e.g. tribal councils, territorial governments) to support a number of eligible communities. For example, in Nunavut, funding for NNC nutrition education initiatives is provided to the Government of Nunavut as part of the consolidated federal-territorial funding agreement, the Northern Wellness Agreement. The Government of Nunavut then provides overarching services and supporting resources for all communities as well community-level funding through the community-based chronic disease prevention program funding stream to deliver their own nutrition education activities as part of their broader community programming. In practice this means that NNC funding is not branded as such and participants are often unaware that certain classes are delivered to them via NNC. However, this integration lets communities combine efforts and funds with other program funds to maximize their resources and increase efficiency in the delivery of nutrition education activities they would like to offer.
Activities where food is offered include, for example: community cooking classes or food tasting with meals or snacks for specific groups within the community, such as for school-aged children, seniors, or the general population, and with food from the classes shared with those attending; or taste testing at stores. These programs are particularly popular as people often perceive them as an opportunity to have a meal. It is difficult to estimate how much knowledge and skills participants derive from these classes. However, their presence in the classroom and even peripheral involvement in the discussion promotes healthy eating and allows participants to make more informed nutritional choices.
At the time of reporting, no data was available to comment on the perception of participants of their knowledge of healthy eating and skills to prepare food. In 2017, a new indicator "Percentage of funding recipients reporting knowledge of healthy eating and skills among residents in eligible communities" was introduced to capture this information. This indicator is intended to provide a general sense of possible benefits, but it will not be indicative of actual acquisition of knowledge and skills as it will be reported by funding recipients, not individuals participating.
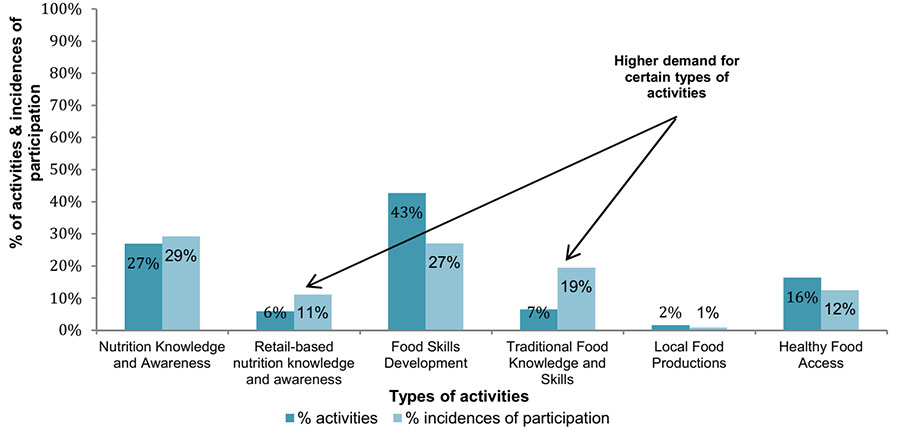
Certain types of activities are more popular among residents than others, especially those that involve food sharing. Figure 7 shows that while six percent of activities were devoted to retail-based nutrition knowledge and awareness, they received 11 percent of total incidences of participation. The same holds true for traditional food knowledge and skills with seven percent of activities and 19 percent of total incidences of participation.
Much of the southern food available in stores in the NNC communities is still relatively new to Northern residents and NNC nutrition education initiatives fill an important information gap to raise awareness about new foods and healthy choices. It was evident from the site visit interviews that there was a clear demand for more education on healthy food alternatives and substitutes. For example, interviewees pointed to a lack of awareness of frozen fruit, berries and vegetables as alternatives to fresh produce and how to prepare them. Frozen fruit, berries and vegetables keep longer and are easier to transport.
Figure 7: Percentage of Nutrition Activities by Type Relative to Popularity (2015-16)
Description of Figure 7: Percentage of Nutrition Activities by Type Relative to Popularity (2015-16)
Figure 7 is a bar graph that illustrates the percentage of various nutrition activities compared to how much participation they generated for 2015-16.
Nutrition Knowledge and Awareness activities accounted for 27 percent of all activities but had 29 percent of the total incidences of participation. Retail-based Nutrition Knowledge and Awareness activities accounted for 6 percent of activities but had 11 percent of the total incidences of participation. Food Skills Development activities accounted for 43 percent of activities but had 27 percent of the total incidences of participation. Traditional Food Knowledge and Skills activities accounted for 7 percent of activities but had 19 percent of the total incidences of participation. Local Food Production activities accounted for 2 percent of activities but had 1 percent of the total incidences of participation. Finally, Healthy Food Access activities accounted for 16 percent of activities but had 12 percent of the total incidences of participation.
Given the feedback received on Nutrition Education Initiatives, it is recommended that ISC:
- Work with communities to disseminate information to better support nutrition education about healthy eating choices including healthy alternatives to fresh fruits and vegetables.
4. Conclusions and Recommendations
There is a need to improve how the Government of Canada helps address the challenges of nutritious perishable food availability and affordability in the North. Northern communities still face numerous barriers contributing to the high cost of healthy food, including geographic isolation and high costs. NNC-eligible communities also face a challenging economic environment, with significantly lower employment rates, participation rates, median household income, as well as higher unemployment rates compared to the rest of Canada, resulting in low purchasing power and alarmingly high rates of food insecurity.
The life in northern communities is predicated on mutual aid, assistance and fairness. Across the site visits and during the 2016 NNC departmental engagement sessions, participants spoke about alternatives to NNC that might specifically target low-income residents. Moreover, participants felt that it would be unfair to make people spend the allowance only on a selected number of foods even if they were designated as nutritious and healthy.
In the absence of means-tested food security measures for the Northerners, however, improvements to the design of NNC are necessary.
It is therefore recommended that CIRNAC:
- Work with communities and representatives of Indigenous peoples and governments to revise the eligible food list to be more relevant to local diets and needs;
- Work with communities and representatives of Indigenous peoples and governments on strategies to further reduce the price of nutritious foods;
- Develop indicators for program impact that look beyond the Revised Northern Food Basket relative to the Consumer Price Index;
- Examine potential new approaches to further improve access to nutritious foods for Northerners, especially for low-income families;
- Develop options to provide support to harvesters for supplies and tools to facilitate sharing of country food within communities, and pursue innovations for locally produced food; and
- Establish better communications with residents of eligible communities about NNC and how it works, especially the personal orders portion of the program.
It is recommended that ISC:
- Work with communities to disseminate information to better support nutrition education about healthy eating choices including healthy alternatives to fresh fruits and vegetables.
Appendix A
| Evaluation Area | Evaluation Question and data collection lead partner(s) |
Evaluation Question Indicator |
|---|---|---|
| Relevance | 1. Is there a continued need for the program? | 1.1 Evidence of/views on the existence of a need for affordable nutritious food and knowledge of healthy eating. |
| 1.2 Gap between Revised Northern Food Basket and Canadian Price Index. | ||
| 1.3 Extent to which program activities and reach align with needs for affordable nutritious food and knowledge of healthy eating. | ||
| 2. To what extent are the objectives of the program aligned with the role and responsibilities of the federal government? | 2.1 Alignment of activities with departmental mandates and roles. | |
| 2.2 Program activities correspond to outcomes of recent/current federal priorities. | ||
| 3. Is there duplication or overlap with other programs, policies and initiatives? | 3.1 Presence/absence of other programs that complement or duplicate the activities or objectives of the program. | |
| Objectives, Results and Effectiveness | To what extent does the program meet its expected results of: 4. Residents in eligible communities have knowledge of healthy eating and skills, and are choosing and preparing healthy foods? |
4.1 Percentage of funding recipients reporting knowledge of healthy eating and skills among residents in eligible communities. |
| 4.2 View of stakeholders regarding the level of healthy eating and skills among residents in eligible communities. | ||
| 4.3 Views of stakeholders on challenges and opportunities for choosing and preparing healthy foods by residents in eligible communities. | ||
| 4.4 Quantity by weight of subsidized perishable nutritious foods available to eligible communities. | ||
| 4.5 Stakeholder views on the extent to which the outcome has been achieved as a result of the program, including best practices, successes, barriers, and challenges. | ||
| 5. Affordability of nutritious perishable food in eligible communities is strengthened? | 5.1 Percentage of disposable income spent on food per week. | |
| 5.2 Evidence of /views on the extent to which the outcome has been achieved as a result of the program. | ||
To what extent does the program meet its expected results of: 6. Residents in eligible communities have access to perishable nutritious foods at a subsidized rate? |
6.1 Quantity by weight of subsidized perishable nutritious foods available to eligible communities. | |
| 6.2 Percentage of annual compliance/ audit reports demonstrating that subsidies have been fully passed onto consumers. | ||
| 6.3 Percentage implementation of the new requirement for major northern retailers to show subsidy saving at the till receipt. | ||
| 6.4 Annual percentage variation in the quantity of subsidized items shipped by air. | ||
| 6.5 Evidence of /views on the extent to which the outcome has been achieved as a result of the program. | ||
| 7. Residents in eligible communities have access to information about the program? | 7.1 Number of public sessions with the Advisory Board | |
| 7.2 Number of communications activities in accessible format and language. | ||
| 7.3 Evidence of /views on the extent to which the outcome has been achieved as a result of the program. | ||
| 7.4 Stakeholder views on the extent to which NNC communications effective at reaching residents living in eligible isolated northern communities. | ||
| 8. Residents in eligible communities have access to retail and community based nutrition education initiatives? | 8.1 Number of participants by type of nutrition education activity. | |
| 8.2 Number of communities delivering nutrition education activities. | ||
| 8.3 Number and types of nutrition education activities by target population groups or venues. | ||
| 8.4 Percentage of funding recipients with trained NNC community workers to deliver programming. | ||
| 8.5 Views of stakeholders on theaccessibility of nutritional educational activities' including format and language. | ||
| 8.6 Stakeholder views on the extent to which the outcome has been achieved as a result of the program, including best practices, successes, barriers, and challenges. | ||
| Efficiency | 9. To what extent are program delivery partners demonstrating economy and efficiency in achieving outputs and progressing towards outcomes? | 9.1 Percentage of program spending on administration and delivery of program activities. |
| 9.2 Variance between planned and actual expenditures, trends and implications. | ||
| 9.3 Evidence of steps taken to enhance efficiency or economy (for example partnerships, etc.). | ||
| 10. To what extent does the program affect the arrangement and management of food supply chain in isolated northern communities? | 10.1 Type and size of retailers operating in eligible communities. | |
| 10.2 Evidence of change in the arrangement and management of food supply chain occurring as a result of the program's activities. |