Archived - Summative Evaluation of the Capital Facilities and Maintenance Program
Archived information
This Web page has been archived on the Web. Archived information is provided for reference, research or record keeping purposes. It is not subject to the Government of Canada Web Standards and has not been altered or updated since it was archived. Please contact us to request a format other than those available.
Date: February 2010
(Project Number: 08045)
PDF Version (282 Kb, 53 Pages)
Table of Contents
- List of Acronyms
- Executive Summary
- Management Response / Action Plan
- 1.0 Introduction
- 2.0 Methodology
- 3. CFM Program Profile
- 4.0 Evaluation Findings
- 5. Findings, Conclusions and Recommendations
- Appendix A - Data
List of Acronyms
Executive Summary
Introduction
The Capital Facilities and Maintenance (CFM) Program provides assistance to First Nations for the establishment of healthy, safe and sustainable communities. Its operational objectives are to make investments that maximize the life cycle of physical assets, mitigate health and safety risks, ensure assets meet applicable codes and standards, and ensure assets are managed in a cost-effective and efficient manner.To meet these objectives, the CFM Program assists eligible recipients to acquire, construct, operate and maintain basic community facilities. The program also provides financial assistance to help eligible recipients in the delivery of their community-based housing programs and provides advisory services to assist First Nations in their roles and responsibilities.
The purpose of the evaluation is to assess the relevance, performance and effectiveness of the CFM Program. It covers the five-year period from 2003-04 to 2007-08, during which time approximately $5.1 billion was spent on the CFM Program. The evaluation scope was limited to assessing the activities and policies implemented during the period identified above.
Methodology
Evaluation findings are based on information gathered from multiple lines of evidence:
- Review of documents;
- Review of financial and administrative data files;
- Literature review;
- Key informant interviews with 13 Indian and Northern Affairs Canada (INAC) Headquarters (HQ) officials and 72 INAC regional officials;
- Key informant interviews with 42 officials from 39 First Nations;
- Key informant interviews with 14 representatives of First Nation organizations;
- Case studies of 31 First Nation communities; and
- Two national focus groups with:
- Members of tribal councils from across the country, and
- Grand Chiefs of various First Nation organizations.
Evaluation Findings
Highlights
The CFM Program continues to be relevant
The evaluation confirmed the relevance of the CFM Program and its alignment with both INAC and federal priorities and objectives. The CFM Program makes an important contribution to First Nations through assisting them to acquire, operate and maintain basic infrastructure. It supports First Nations in establishing safe, healthy, and sustainable communities. Without CFM funding, many infrastructure-related projects would not be possible.
Roles are well understood
Roles, responsibilities, and terminology are generally well understood, especially among experienced First Nation and INAC program officials.
Decision making and the allocation of funds accord with national criteria
The decision-making process for funding allocations aligns with national priorities in all regions. All regions use INAC's National Priority Ranking Framework as a guide for making decisions with respect to funding allocations. An exception was noted where some regions allocate surplus funds at fiscal year end to projects that can be completed quickly, and which may not fall into the highest priority categories.
The CFM Program is addressing the highest priority areas
The CFM Program was seen to be achieving its top priorities, but the availability of funding for lower priority issues has been limited. Significant progress has been made in achieving the top priority for access to drinking water that meets current safety standards. The CFM Program has also supported wastewater projects in recent years. First Nation evaluation participants acknowledged the importance of dealing with these priority areas, but also ranked housing high or highest among their own community infrastructure priorities.
Regional delivery varies for Operations and Management (O&M) and minor capital, but the differences do not impact on program performance
The allocation of major capital funding is similar throughout most regions. Each region varies, however, with respect to how it delivers the O&M and minor capital components of the program. Success of the program does not seem to be linked with the method of program delivery. Rather, other factors, such as the First Nation community's proximity to an urban centre, expertise and involvement from the tribal council, and its ability to generate own-source revenue all impact the performance of the CFM Program.
Project progress is monitored but performance measurement is limited
All regions monitor projects to varying degrees but performance measures are limited. Monitoring of major capital appears to be adequate in all regions, but there is little consistency in the monitoring of minor capital projects and O&M funding. There is an opportunity for significant improvement regarding the measurement of outcome indicators, however, once the Integrated Capital Management System is fully implemented in the regions. The Department continues to work toward removing any system problems and is committed to training users in using this new system to record, monitor and report on the spending and condition of their assets in their regional inventories.
There is widespread concern with the level of O&M funding provided through the program
Across the country, First Nation and INAC officials were concerned that O&M funding is insufficient. Concerns were also raised about the formula used to calculate O&M, the allowable annual increments and the fact that cost reference manuals were outdated and do not reflect adequately the costs borne by rural and remote communities. As well, First Nations desire improved transparency regarding the funding allocation process and better alignment between the timing of the funding approval process and the construction season.
Communications between First Nations and regional offices could be improved
There is room for improvement in certain areas, such as communications between First Nations and regional offices, and in the timeliness of project funding. High staff turnover and weak knowledge transfer were blamed for communication breakdowns.
Value for money is implied through proxy measures
Data were insufficient to enable a quantitative assessment of results achieved relative to money spent. On the other hand, given the fact that major capital projects are being carried out in line with national priorities and that achievements are being observed within competitive procurement guidelines, it does appear that there is value for money. As well, the association of CFM funding with the highest priority health and safety projects means that the money is being spent in areas of greatest need nationally.
Best practices identified
The evaluation identified various exemplary practices used in managing and delivering the CFM program. Three of these are worthy of broader consideration.
First, the evaluation noted particular success through using bank financing to ensure the timely completion of major capital projects. The INAC regional office issues a letter of comfort (non-binding) and this enables the First Nation to secure sufficient funds from its bank to complete an already approved project. The First Nation pays the applicable interest and is then reimbursed by INAC when the funds become available. INAC does not reimburse the interest costs. Even if the INAC funding is spread over more than one fiscal year, it will be applied to the principal of the bank loan.
This practice has proven to be successful in the Quebec region, enabling First Nations to complete priority projects more expediently. It helps the region to avoid year end lapses and is consistent with federal financial regulations, as it allows the funding to be used for the approved priority projects and payments are done for work that has been completed.
Secondly, several regions access technical support and training available through the Circuit Rider Program. The program provides on-site training several times each year for First Nation water and water distribution operators. Case study participants in the Yukon, Quebec, Alberta and British Columbia (BC) regions cited the usefulness of this program in providing access to needed expertise in water management in a cost-effective manner. A number of First Nation respondents commented that their water operators have become certified and that there is interest in expanding the certification program to other capital-related areas.
The third exemplary practice is the BC region's successful and comprehensive risk assessment tool, which has been used by CFM HQ as a model to develop its national risk assessment tool. Since 1993, BC has also used a computerized, in-house project management system, the Capital Project Management System (CPMS). The CPMS holds project information and generates templates for project approvals. The CPMS database tool tracks projects from feasibility to completion, including approvals at each stage, project funding allocations and reporting requirements. Some of its functions are now replicated within the First Nations and Inuit Transfer Payment system.
Evaluation Recommendations
- The CFM Program should be renewed on the basis of demonstrated relevance, accomplishments, ongoing need, and First Nation priorities.
- INAC, in consultation with First Nations and tribal councils, should revisit and modernize the formula underlying O&M funding to ensure it reflects current day realities and cost structures, and creates incentives for adequate maintenance of community infrastructure.
- INAC should improve cost and performance measures related to infrastructure (financial and non-financial information).
- INAC and First Nations should work together, in consultation with tribal councils, to:
- Letters of comfort to secure bank financing on the basis of project approval, in order to avoid unnecessary delays in project implementation;
- Improved training in project management and technical areas to augment the skill base within First Nation administrations, which will enable those First Nations to reduce their expenditures on outside consultants and speed up their project application processes, and expand the certification elements of the Circuit Rider Program to other capital-related areas; and
- Provide funding on a multi-year basis and/or re-profile funding to compensate for construction delays.
Management Response / Action Plan
| Recommendations | Actions | Responsible Manager (Title / Sector) | Planned Implementation and Completion Dates |
|---|---|---|---|
| 1. The CFM program should be renewed on the basis of demonstrated relevance, accomplishments, ongoing need, and First Nation priorities. | a) Community Infrastructure Branch to proceed with steps to renew the CFM Program. | a) Director General, Community Infrastructure Branch, ESDPP | 31/03/2010 |
| b) Community Infrastructure Branch to respond to Budget 2010's commitment to undertake a comprehensive review of the current approach to financing First Nations' infrastructure by developing a new approach to funding infrastructure on reserves and supporting First Nations in improving the life-cycle management of their infrastructure assets. | b) Director General, Community Infrastructure Branch, ESDPP | 31/03/2011 | |
| 2. INAC, in consultation with First Nations and tribal councils, should revisit and modernize the formula underlying O&M funding to ensure it reflects current day realities and cost structures and creates incentives for adequate maintenance of community infrastructure. | a) Community Infrastructure Branch to work with Operations and Planning Support Branch and Chief Financial Office Sector to develop options to modernize O&M funding formulas, including measures to improve outcomes with O&M funding. | a) Director General, Community Infrastructure Branch, ESDPP | 31/03/2011 |
| b) Community Infrastructure Branch to engage key stakeholders in discussing proposed options for modernizing O&M funding. | b) Director General, Community Infrastructure Branch, ESDPP | 31/12/2011 | |
| c) Operations and Planning Support Branch to work with Community Infrastructure Branch, Chief Financial Office Sector and Regional Offices to implement recommended approach to modernizing O&M funding. | c) Director General, Operations and Planning Support Branch, Regional Operations Sector | 31/03/2012 | |
| 3. INAC should improve cost and performance measures related to infrastructure (financial and non-financial information). | a) Community Infrastructure Branch developed new performance indicators (financial and non-financial, output and outcome). | a) Director General, Community Infrastructure Branch, ESDPP | 8/12/2009 |
| b) Community Infrastructure Branch to work with Operations and Planning Support Branch and Regional Offices to amend reporting tools and improve inspection regimes so that information for new performance indicators can be properly collected. | b) Director General, Community Infrastructure Branch, ESDPP | 31/03/2011 | |
| c) Operations and Planning Support Branch to work with Community Infrastructure Branch and Regional Offices to fully implement the National Planning Process associated with the new First Nations Infrastructure Investment Plan. | c) Director General, Regional Operations and Planning Support Branch, Regional Operations Sector | 31/03/2011 | |
| 4. INAC and First Nations should work together, in consultation with tribal councils, to: a) improve the timeliness of communications at the regional level; and |
a) Community Infrastructure Branch to work with Regional Operations and Planning Support Branch and Regional Offices to develop service standards relating to communication protocols with First Nations, including the enhancement of program communication through improvements to the INAC intranet website. | a) Director General, Community Infrastructure Branch, ESDPP & Director General, Operations and Planning Support Branch, Regional Operations Sector | 31/03/2011 |
| b) integrate reporting requirements (including performance measures). | b) Community Infrastructure Branch to work with Regional Operations and Planning Support Branch to integrate / align reporting requirements with performance indicator information requirements. | b) Director General, Community Infrastructure Branch, ESDPP | 31/03/2011 |
| 5. INAC and First Nations should pursue those practices identified by the evaluation as demonstrating good management and effective delivery. These include, but are not limited to: a) Letters of comfort to secure bank financing on the basis of project approval, in order to avoid unnecessary delays in project implementation; |
a) Community Infrastructure Branch to undertake a comprehensive review of the current-approach to financing First Nations infrastructure, including the identification of best practices that can support effective financing and delivery of capital projects in a timely manner. | a) Director General, Community Infrastructure Branch, ESDPP | 31/03/2011 |
| b) Improved training in project management and technical areas to augment the skill base within First Nation administrations, which will enable those First Nations to reduce their expenditures on outside consultants and speed up their project application processes, and expand the certification elements of the Circuit Rider Program to other capital-related areas; and | b) Community Infrastructure Branch will continue to emphasize the use of the capacity development funding stream within the First Nations Infrastructure Fund. Subject to resource availability, Community Infrastructure Branch will look at options to expand existing capacity development programs. | b) Director General, Community Infrastructure Branch, ESDPP | 31/03/2011 |
| c) Provide funding on a multi-year basis and/or re-profile funding to compensate for construction delays. | c) Chief Financial Office to develop multi-year funding arrangement models (flexible contribution) as part of department's implementation of the new Transfer Payment Policy. | c) Director General, Corporate Accounting and Material Management Branch, Chief Financial Office Sector & Director General, Community Infrastructure Branch, ESDPP | 31/03/2011 |
1.0 Introduction
This report presents the findings of a summative evaluation undertaken by the Evaluation, Performance Measurement, and Review Branch (EPMRB) in the Audit and Evaluation Sector of Indian and Northern Affairs Canada (INAC). It assesses the Capital Facilities and Maintenance (CFM) Program and includes a description of the evaluation scope and methodology, evaluation findings and recommendations. The evaluation was carried out under the direction of a senior evaluation manager from EPMRB.
1.1 Evaluation Purpose and Scope
The purpose of the evaluation is to assess the relevance, performance and effectiveness of the CFM Program in relation to current policy initiatives.
The program evaluation is national in scope. It covers the five-year period from 2003-04 to 2007-08, during which time approximately $5.1 billion was spent on the CFM Program. The evaluation scope was limited to assessing the activities and policies implemented during the period identified above. Section 3.0 provides a profile of the CFM Program.
1.2 Evaluation Issues
The following issues were intended to guide the evaluation:
Rationale and Relevance
- To what extent does the CFM Program respond to federal government priorities, First Nation needs and local priorities?
- To what extent do the linkages between CFM and departmental programs, and federal and provincial/territorial partners contribute to meeting department and government objectives?
- To what extent is the CFM Program aligned with core federal roles?
Design
- To what extent are the objectives of the CFM Program clearly articulated and understood?
- To what extent are the roles, responsibilities and accountability of key players clear and well understood? Is there clear understanding of the terminology used?
- To what extent does the CFM Program planning process ensure that appropriate decision making is in line with program objectives?
- To what extent is there a good connection/link between First Nation needs, priorities and CFM budget process and operational management?
- To what extent are there limitations in the design and operations of CFM?
- To what extent does the design of the CFM Program lead to consistent national results?
- To what extent does the allocation methodology implemented through the CFM Program align with program objectives?
- To what extent does the CFM Program design compare with municipal infrastructure programming?
- To what extent does the CFM Program design contain the appropriate incentives for the program recipients? How do the CFM Program incentives/disincentives compare with those of regional municipalities?
Delivery
- To what extent:
- do means and tools (including performance indicators) exist for obtaining reliable evidence of program success/performance?
- are performance information/measures collected (evaluation of project results) on each level of results (outputs, immediate, intermediate, and ultimate outcomes)? If yes, is it used to: a) monitor performance; b) report results (periodically); and c) report on CFM results in the Departmental Performance Report (DPR)? (Compare DPR with evaluation results)?
- To what extent is the CFM Program (including the management regime) implemented consistently across regions for all types of investments (core vs. non-core)? If not, why and what is the impact on the outcomes?
- To what extent are committees working as planned?
- To what extent is there good monitoring in place (including documentation, inventory system/data, management system, project completion report, certification of completion, and inspection)?
- To what extent are the key players fulfilling their roles, responsibilities and accountability as planned? (What are the key program delivery differences across the country?)
- To what extent is the allocation/reallocation process/methodology (including capital budgets, allocation criteria (i.e. National Priority Ranking Framework (NPRF), and reserves) implemented as planned? If not, why?
- To what extent are risks to the CFM Program managed?
- To what extent are Operations and Maintenance (O&M) funds used for intended purposes?
- To what extent are Capital Major and Minor Projects, O&M, and Targeted Programs in compliance with the terms and conditions?
- To what extent have the audit, review, and evaluation recommendations been implemented? If not, why?
Success
- Is the CFM Program successful in achieving its objectives and intended results? Does this vary regionally?
- What are the key limitations in the operations of the CFM Program that hinder meeting the objectives?
- How does the CFM Program perform with respect to national priorities?
- Are committees/boards providing: a) oversight; b) value-added; and c) alternatives or ways to improve boards/committees?
- Is the success/performance linked to variations in program delivery? (e.g., are results achieved linked to the numbers of staff delivering the program and overall delivery differences in regions)?
- What are the external influences affecting the CFM Program success and performance?
- How much was reallocated to education and social programming? What has been the impact on CFM results? What has been the impact on education programs and social programs?
- Are the regions/First Nations accessing cost leveraging? If yes, what are the benefits? If no, is there a way to improve it?
- Is the CFM Program sustainable with respect to:
- adequate annual increment to meet growth;
- comprehensive approach to asset life management;
- community-based planning;
- supporting First Nations in attaining infrastructure standards comparable to those off reserve;
- access to other funding/financing sources (including cost leveraging); and
- collaboration between INAC Headquarters (HQ) – INAC regions – First Nations and collaboration with provincial/territorial and other federal partners.
- Is CFM providing value for money (relevant, economy, and efficient use of resources and effectiveness)?
Cost-effectiveness/Alternatives
- What is the ratio of results achieved to money spent (core vs. non-core, major vs. minor, others)?
- Are best practices used in managing/delivering the CFM Program?
- Are there alternatives or ways to improve CFM management?
- Are there alternatives or ways to better deliver capital/community infrastructure?
- Are there alternatives or ways to better achieve CFM objectives?
- How does the CFM Program compare with relevant off-reserve infrastructure securitization, support and delivery models in terms of value for money?
1.3 Evaluation Approach
The evaluation involved an in-depth examination of documents/data files and literature, data collection, analysis and reporting as summarized in the next section. Consultants from the Centre for Public Management Inc. along with EPMRB evaluators conducted all fieldwork. The report has been prepared by T. K. Gussman Associates Inc.
2.0 Methodology
Evaluation findings are based on evidence collected from the following lines of inquiry:
- Review of documents and data;
- Literature review;
- Key informant interviews with HQ and regional INAC officials;
- Key informant interviews with First Nations and First Nation organizations;
- Case studies of 31 First Nation communities; and
- Two focus groups with First Nation organizations and four tribal councils.
Table 1 below summarizes the number of officials participating in each line of inquiry:
| Region | Key Informant Interviews | Focus Groups | Case Studies | ||||
|---|---|---|---|---|---|---|---|
| INAC1 | First Nations | First Nation Organizations | Tribal Councils | First Nation Organizations | INAC1 | First Nations/ (communities) | |
| National Capital Region | 13 | 1 | 1 | ||||
| Atlantic | 7 | 3 | 1 | 5 | 7 (4) | ||
| Quebec | 12 | 7 | 11 | 8 (4) | |||
| Ontario | 20 | 8 | 2 | 1 | 4 | 9 | 23 (5) |
| Manitoba | 8 | 7 | 1 | 1 | 4 | 3 (4) | |
| Saskatchewan | 7 | 3 | 5 | 6 (3) | |||
| Alberta | 9 | 4 | 3 | 21 (4) | |||
| British Columbia | 6 | 8 | 2 (1) | 4 | 14 (5) | ||
| Yukon | 3 | 2 | 3 | 2 (2) | |||
| Total | 85 | 42 | 3 | 5 (4) | 6 | 44 | 84 (31) |
1Some regional INAC officials participated in both key informant interviews and case studies.
2.1 Document and Data Review
Documents reviewed for this evaluation included the CFM Program terms and conditions, corporate manuals, program reports and presentations, previous audits and evaluations, records of actions taken, and various other reports/papers as identified by the Project Authority. Information contained in the documents was examined and analyzed for evidence that would support the assessment of the full range of evaluation issues.
The data review provided an analysis of program-related data contained in existing INAC databases and management systems. Expenditure data were collected to update the resources component of the CFM Program profiles and to report on historical trends at the national and regional levels. National databases and management information systems included in the review were: Annual Reference Level Update (ARLU); the Integrated Capital Management System (ICMS); and the 2008 Compendium of INAC Program Data. Regional offices track program spending and maintain databases in both paper-based and electronic formats.
2.2 Literature Review
A review of literature was conducted to provide information on issues facing First Nation infrastructure programs domestically and internationally. The review helped to inform the evaluation on relevance, design, success and cost-effectiveness issues. Literature reviewed included studies conducted in Australia, New Zealand, the United States and Canada, comprising government statistical reports, academic articles and First Nation organization policy papers.
2.3 Key Informant Interviews and Focus Groups
In-person interviews were conducted in clusters, beginning with INAC HQ program officials followed by interviews and focus groups with regional program officials in order to ensure that the consultants understood the program well before interviewing First Nation stakeholders. Interviews with First Nation representatives were conducted primarily by telephone.
INAC HQ officials interviewed included key respondents within the Education and Social Development Programs and Partnerships Sector, and the Regional Operations Sector. [Note 1] Officials interviewed in INAC regions included capital managers, capital officers, associate regional directors general, and/or regional directors general.
A random sample, stratified by region, population, project types and remoteness, was used to select First Nation participants. As well, two national focus groups were conducted – one with members of tribal councils from across the country and one with the Grand Chiefs of various First Nation organizations.
A total of 13 INAC HQ officials and 72 INAC regional officials were interviewed and/or participated in focus groups. Forty-two representatives of 38 First Nations participated in interviews and 14 representatives of First Nation organizations and tribal councils participated in interviews or national focus groups. Regional focus groups centred on the Capital Officers' regional perspective on CFM, while the main subject of the national focus group was the national perspective on CFM by various First Nation organizations and tribal councils.
2.4 Case Studies
Fieldwork for the case studies took place during the period from May 25 to August 15, 2009. In total, 31 case studies were conducted with First Nation communities, with at least two taking place in each of the eight INAC regions. The selection was based on a stratified random sample by region and on-reserve population, and was finalized upon receipt of a list of CFM projects and input from the working group. The sample included large and small communities with various levels of remoteness. Participating communities had undertaken capital projects in a variety of CFM funding categories.
In cases where a site visit could not be coordinated due to conflicts in scheduling, an appropriate replacement case study was selected and approved by the project authority. Case study interviews in the Manitoba region were conducted by telephone due to an H1N1 flu outbreak among various First Nation reserves in that region.
Case studies involved a review of relevant documents, interviews with regional program officials, First Nation chiefs and/or band managers, and/or staff responsible for projects. Where possible, data collection was coordinated with the First Nations Infrastructure Fund (FNIF) evaluation work. A total of 128 officials were interviewed overall. INAC officials generally took part in multiple case studies within their regions. They are counted only once in Table 1, which summarizes the number of interviews that took place.
2.5 Challenges and Constraints
The evaluation was constrained by a lack of results-based performance data on program outcomes. As well, evaluators were not provided with a regional breakdown of CFM spending. For most regions, available data were presented on a band-by-band, project-by-project basis in separate files for each fiscal year. Some regional information was presented electronically on spreadsheets, while other sources were scanned copies of manual work sheets. In some cases, it was not possible to relate funding to particular fiscal years.
Due to an outbreak of the H1N1 flu on First Nation reserves in Manitoba, on-site visits were not possible. To mitigate this situation, the case study interviews with regional program officials and First Nation representatives in this region were conducted by telephone.
3. CFM Program Profile
3.1 Program Objectives and Background
The goal of the CFM Program is to provide assistance to First Nations for the establishment of healthy, safe and sustainable communities. Its operational objectives are to make investments that maximize the life cycle of physical assets, mitigate health and safety risks, ensure assets meet applicable codes and standards, and ensure assets are managed in a cost-effective and efficient manner. To meet these objectives, the CFM Program assists eligible recipients to acquire, construct, operate and maintain basic community facilities, including:
- Water and sewer;
- Solid waste disposal;
- Schools;
- Fire protection (fire trucks, fire halls, fire equipment);
- Electrification (electrical power generation and distribution);
- Roads and bridges; and
- Community buildings.
The CFM Program provides financial assistance to help eligible recipients in the delivery of their community-based housing programs and provides advisory services to assist First Nations in their roles and responsibilities. It also assists in the review and development of policy directives and standards in the management of the program.
The CFM Program has evolved substantially over the years. Notable changes/factors that have contributed to the evolution of the program include:
- the creation and inclusion under the CFM 'umbrella' of a number of INAC programs and "special initiatives/targeted funding" that provide support for First Nations' infrastructure and support the objectives of the CFM Program;
- changes in policy, expectations, and the roles and responsibilities of INAC staff and First Nations as a result of the devolution process;
- the use of a variety of funding instruments; and
- the downsizing of INAC's human resources, especially in the area of technical services.
The CFM planning process comprises the tools and activities used by INAC staff to prioritize between competing needs and managing allocations to First Nations to carry out activities under the CFM Program.
INAC has a strong interest in ensuring that planning for the CFM Program is effective, efficient, and supports improved outcomes for First Nations. During the period covered by the evaluation, the CFM planning process was anchored in INAC's 2002-03 Long-term Capital Plan (LTCP). This LTCP contains three distinct capital program areas: custodial assets; northern contaminated sites; and the CFM Program.
INAC provided yearly updates on spending for these three program areas through the ARLU process: annual updates on actual and forecasted overall spending for the CFM Program and spending by asset category, in addition to listing individual major capital projects (i.e., projects with value greater than $1.5 million). This listing of major capital projects has become the primary accounting and planning tool for the CFM Program at the national level.
In addition to the LTCP's major capital project listing, the planning process for the CFM contains several other pillars at the national and regional levels.
First, the LTCP contains a Capital Management Regime, which outlines the governance structure and processes in place to ensure effective management of the Department's capital programs, including the CFM Program.
Secondly, the national capital priorities listed in the 2002-03 LTCP were refined into a detailed NPRF for the CFM Program in year 2005.
Third, in August 2007, the Department's National Investment Management Board was re-established as the National Capital Management Board (NCMB). The NCMB is intended to provide strategic oversight for the management of the Department's capital programs.
Fourth, performance measurement using data on First Nations assets (now housed in ICMS) can be used to support the planning process.
While there is some variation in how the CFM Program is delivered by INAC's regional offices, there are several common activities. Regions compile rolling five-year major capital plans, which form the basis for the national major capital plan listed in the LTCP. Regions are also expected to use the NPRF to guide their prioritization of major capital projects and do so, in varying fashion. At the regional level, the funding allocation process for the CFM Program is overseen by Regional Investment Management Boards and is necessarily impacted by the decisions of Regional Financial Management Committees.
First Nations generally have greater discretion over the use of minor capital (for projects with values less than $1.5 million and for housing) and O&M funding. Major capital funding is allocated on a project-specific basis to all First Nations by INAC regional offices.
3.2 Roles and Responsibilities
The management control framework for the CFM Program provides management guidelines for governance, financial management, policies and guidelines for funding, outputs/indicators and reporting, risk assessment, and monitoring, auditing and evaluation.
HQ is responsible for: developing an overall policy, and for acquiring and allocating resources to regions; developing and updating the departmental LTCP in consultation with regions and First Nations; developing national criteria, policies and directives for program delivery; developing reporting requirements and managing program data and performance measurement; and coordinating and seeking capital approvals from Treasury Board for specific projects that exceed delegated departmental authority levels.
Regional offices are responsible for: setting priorities consistent with national criteria and methodology; providing advice to First Nations regarding development and implementation of their capital plans; developing regional long-term capital plans; allocating funding to, and negotiating and approving capital funding arrangements with First Nations; managing capital funding arrangements in compliance with departmental policies and directives; allocating O&M funding to First Nations based on O&M performance and assessment, including corrective actions required by inspections; and monitoring capital management activities undertaken by First Nations.
Technical services personnel provide policy and technical advice to INAC HQ and regions regarding: technical capacity, levels of service standards and costing tools for the various non-custodial facilities and infrastructure, and work along with networks for municipal services, capacity building, and environmental protection for on-reserve capital facilities and infrastructure.
First Nations are responsible for: developing and implementing their capital plans; implementing and managing capital projects and activities pursuant to the plans; maintaining existing assets; complying with the terms and conditions of the funding arrangements; and collecting data specified in the annual First Nations Recipient Reporting Guide.
3.3 Allocation Processes
Nationally, allocations are managed through INAC's global funding regime. Under this funding methodology, regions have the flexibility to move funding allocated for "core" and "non-core" activities to meet regional funding priorities. With respect to the management of capital resources, regions are required to have a capital allocation process in place that identifies and addresses national priorities. These priorities must be consistent with the LTCP Management Framework and include the identification of specific targets for major and minor capital expenditures and for the O&M of on-reserve community facilities.
Figure 1 below provides a visual representation of the CFM allocation process. Capital allocations are made on the basis of major and minor capital projects. Core funding is used for ongoing minor capital and facilities O&M activities. Major capital is included, as part of INAC regions' non-core allocation, to fund projects of $1.5 million or more.
HQ transfers additional funds to regions specifically for special infrastructure initiatives or targeted programs, which INAC delivers with other federal partners such as Health Canada, Canada Mortgage and Housing Corporation (CMHC), Public Works and Government Services Canada, Environment Canada, Human Resources and Skills Development Canada, and Infrastructure Canada. These additional funds are treated as non-core allotments to regions.
Figure 1: Allocation from Headquarters to Regions Overview
Allocation from Headquarters to Regions
Overview
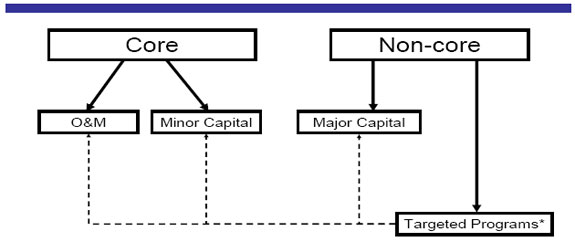
*Targeted programs can fund all three funding streams
Figure 1 above provides a visual representation of the CFM allocation process. Allocations are made from headquarters to the regions. Capital allocations are made on the basis of major and minor capital projects.
Nationally, allocations are managed through INAC's global funding regime. Under this funding methodology, regions have the flexibility to move funding allocated for "core" and "non-core" activities to meet regional funding priorities.
With respect to the management of capital resources, regions are required to have a capital allocation process in place that identifies and addresses national priorities. These priorities must include the identification of specific targets for major and minor capital expenditures and for the O&M of on-reserve community facilities.
The 2 funding streams are Core and Non-core funding. The Figure shows that:
Core funding: is divided into two areas, Minor Capital and Operations and Maintenance (O&M) activities. The Core stream is used for ongoing Minor Capital and facilities O&M activities.
- Minor Capital: is funding provided to First Nations for housing and for construction, acquisition, renovation, or significant repair projects with value below $1.5 million
- Operations and Maintenance: is funding provided to First Nations for the maintenance and operation of existing assets.
Non-core funding: is made up of Major capital and Target Programs; Major Capital is included, as part of INAC regions' non-core allocation, to fund projects of $1.5 million or more.
- Major Capital: funding provided to First Nations for specific, proposal-driven construction, acquisition, renovation, or significant repair projects with value exceeding $1.5 million.
- Targeted Programs or Special infrastructure initiatives: INAC delivers these with other federal partners such as Health Canada, Canada Mortgage and Housing Corporation (CMHC), Public Works and Government Services Canada (PWGSC), Environment Canada, Human Resources and Skills Development Canada (HRSDC) and Infrastructure Canada. These are additional funds treated as non-core allotments to regions.
Regions also allocate capital funds to First Nations based on core and non-core components. Non-core or major capital funding is allocated in all regions on a proposal-driven basis and funding decisions are made on an identified need basis by regional offices in accordance with LTCP priorities. Allocation of core capital (minor capital and O&M) dollars depends on the type of funding arrangement in place and regional operational processes. First Nations under a multi-year agreement, such as a Canada-First Nation Funding Agreement receive funding through core and non-core allocations similar to the Department's global funding regime. In most regions, First Nations under one-year Comprehensive Funding Arrangements (CFAs) receive minor capital allotments in accordance with a population-driven formula. O&M allocations under CFAs are based on the estimated costs of operating and maintaining existing assets using a methodology from the cost-reference manual.
3.4 Financial Resources
Between 2003-04 and 2007-08, actual and planned expenditures grew from $967 million to $1,136 million, an average annual growth of 3.4 percent. Most of this increase occurred between 2005-06 and 2006-07 when actual expenditures increased by 12.6 percent rather than the usual one to two percentage points. The bulk of that growth was due to a sharp increase in spending on minor capital projects, where the noticeable increase in housing expenditures was offset only marginally by a decrease in infrastructure spending. [Note 2] Planned spending on housing was to have returned to normal reference levels in subsequent reporting periods. Planned spending for 2008-09 was expected to decrease by two percent from the previous year's reference level. Spending on minor capital education projects was planned to more than double in 2007-08 and 2008-09 from previously observed levels. [Note 3] Table 2 shows the breakdown by asset category for this period.
| Capital Facilities and Maintenance | 2003-2004 | 2004-2005 | 2005-2006 | 2006-2007 | 2007-2008 | 2008-2009 Planned [Note 4] |
|---|---|---|---|---|---|---|
| Major Capital Projects | ||||||
| Infrastructure* | $176,172 | $166,757 | $166,427 | $208,008 | $229,291 | $173,815 |
| Education | $90,264 | $101,805 | $73,332 | $75,608 | $110,664 | $74,927 |
| Housing | $8,282 | $6,165 | $16,308 | $15,456 | $27,483 | $3,025 |
| Sub-Total Major | $274,718 | $274,726 | $256,067 | $299,071 | $367,438 | $251,767 |
| Minor Capital Projects | ||||||
| Infrastructure* | $199,546 | $191,043 | $215,751 | $178,283 | $116,349 | $203,366 |
| Education | $28,665 | $15,954 | $16,717 | $22,445 | $17,403 | $56,289 |
| Housing | $125,212 | $126,512 | $145,068 | $235,136 | $142,999 | $134,628 |
| Sub-Total Minor | $353,423 | $333,510 | $377,536 | $435,864 | $276,751 | $394,283 |
| CFM – O&M | ||||||
| Infrastructure* | $242,521 | $265,140 | $253,695 | $279,122 | $279,122 | $237,141 |
| Education | $92,859 | $95,690 | $98,966 | $96,723 | $108,332 | $105,023 |
| Housing | $3,290 | $3,640 | $3,779 | $3,934 | $3,949 | $3,940 |
| Sub-Total O&M | $338,670 | $364,470 | $356,440 | $379,779 | $391,403 | $346,104 |
| Total CFM Spending on Major and Minor Capital Projects and O&M | ||||||
| Infrastructure* | $618,239 | $622,940 | $635,873 | $665,413 | $624,762 | $614,322 |
| Education** | $211,788 | $213,449 | $189,015 | $194,776 | $236,349 | $236,239 |
| Housing | $136,784 | $136,317 | $165,155 | $254,526 | $163,699 | $141,593 |
| CFM – Grand Total | $966,811 | $972,705 | $990,043 | $1,114,715 | $1,035,593 | $992,154 |
* Includes expenditures on community infrastructure, water and sewer, roads, electrification and contaminated sites. Table A1 in Appendix A provides a percentage breakdown of infrastructure spending.
Source: ARLU (except 2008-2009)
**In budget 2006, the Government invested an additional $47.4 million in the education infrastructure; this increase is reflected in the 2007/08 and 2008/09 years
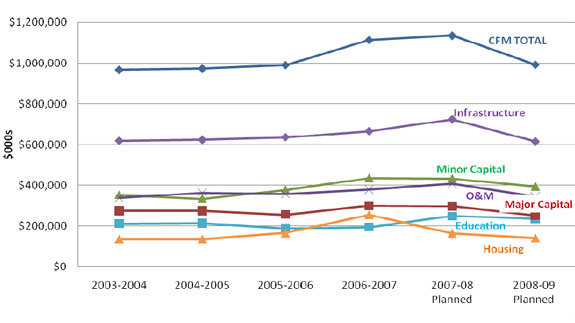
Proportionately, O&M expenditures remained constant at approximately 35 percent of total CFM Program spending throughout the period. Spending on major capital projects fluctuated at levels between 25 and 28 percent, with no observable trend. Figure 2 provides a graphic display of total CFM Program spending in the various asset categories. It is helpful to note that the CFM total represents the aggregation of two distinct data sets. The total can be calculated by adding major capital, minor capital and O&M or adding infrastructure, education and housing. The graphic depiction of each of these in Figure 2 helps to understand their relative contribution to CFM spending.
Figure 2: Total CFM Spending by Asset Class
Source: ARLU
Figure 2 provides a graphic display of total CFM program spending in the various asset categories (Housing, Education, Major Capital, O&M, Minor Capital, Infrastructure and CFM Total), over the years 2003-04 up to 2008-09; each is represented by a line that ascends or descends in a particular year. The years are indicated along the x axis and the dollar amounts are indicated along the y axis.
According to the graph, the dollar amount was as follows:
- For Housing: less than $200,000 in 2003-04 up to 2005-06 but more than that amount in 2006-07, then dropped below $200,000 in both 2007-08 and 2008-09;
- For Education: $200,000 in 2003-04, 2004-05 and 2006-2007 but dropped slightly in 2005-2006 and rose higher than $200,000 in 2007-08 and 2008-09;
- For Major Capital: above $200,000 in all the years;
- For O&M: above $200,000 in all the years, reaching $400,000 in 2007-08 then dropping in 2008-09;
- For Minor Capital: above $300,000 in all the years and above $400,000 in 2006-07 and2007-08, but falling slightly in 2008-09;
- For Infrastructure: above $600,000 in all the years and above $700,000 in 2007-08 then dropping in 2008-09 to just above $600,000; and,
- For CFM Total: just below $1Million from 2003-04 to 2005-06, then above $1.1 Million in 2006-07 and2007-08, then falling to $1Million in 2008-09;
The CFM total represents the aggregation of two distinct data sets. The total can be calculated by adding major capital, minor capital and O&M or adding infrastructure, education and housing. The graphic depiction of each of these in Figure 2 helps to understand their relative contribution to CFM spending.
The graph illustrates that the infrastructure dollar amount was markedly higher than the amounts of the other asset categories.
4.0 Evaluation Findings
4.1 Rationale/Relevance Summary of Findings
4.1.1 Alignment with Federal Priorities and Objectives
The evaluation found that the CFM Program aligns with core federal priorities and objectives to support Canada's First Nations in the pursuit of health and sustainable communities. Specifically, INAC's 2009-10 Report on Plans and Priorities identifies as an expected result that First Nation communities will have a "base of infrastructure that protects the health and safety and enables engagement in the economy." Almost all INAC HQ and regional respondents saw a direct alignment between the priorities of the CFM Program and these federal objectives. Limited funding was seen to challenge the program's ability to address local priorities, which may not align directly with those at the national and regional levels.
4.1.2 Continued Relevance
The evaluation found that First Nations have a continuing need for assistance in acquiring and maintaining reserve infrastructure. Evidence from First Nation interviews, case studies and focus groups made it clear that First Nations consider the CFM Program to be essential. Most First Nations have limited own-source revenues and the CFM Program is considered very relevant in enabling them to address their infrastructure needs.
In all regions, program recipients pointed out that the CFM Program supports important infrastructure projects to mitigate potential health and safety risks to First Nation communities. This is evidenced by the numerous projects that have been funded over the past five years to support improvements to water quality, wastewater, schools, solid waste disposal, fire protection, electrification, roads, and community buildings. The majority of participants in the case studies believed that, without CFM funding, many of the infrastructure projects would likely not have been completed in a timely manner, if at all. As well, stakeholders saw the program's support of on-reserve infrastructure as furthering the potential for future economic development.
For the past five years, the top priority of the CFM Program has been to ensure that First Nations have access to drinking water that meets current safety standards. The program has also focused significant attention on wastewater projects recently. The importance of attaching priority to improving safe drinking water and sewage services in Aboriginal communities is corroborated in literature from Australia and New Zealand that links health outcomes to the quality of the physical environment and housing amenities. [Note 5]
At the same time, the focus on water and wastewater priorities over the period under review, coupled with limited available funding, has constrained the CFM Program's ability to address other First Nation infrastructure-related needs in a thorough manner. Almost all First Nation officials, including focus group participants, pointed to funding limitations as the key factor for current priorities not being addressed. While water and sewer projects continue to be high priorities for health and safety, many First Nation respondents indicated that current needs focus on other issues such as housing, and roads and bridges. In a majority of case studies, First Nation respondents placed the housing issue high (or highest) among their community infrastructure priorities.
Population growth is a significant factor for many communities. Housing shortages lead to overcrowding, which in turn can lead to serious health and safety problems. This was noted as a particular concern during case study and key informant interviews. Many communities have overcrowded homes in substandard condition. Such homes require renovation or even replacement if they are to meet modern-day housing standards. As well, evaluation participants identified a need to create more serviced housing lots in order to allow additions to the housing stock.
4.1.3 Program Linkages
The evaluation found that First Nations also rely on provincial and territorial programs for health and safety concerns. Federal and provincial programs for infrastructure are delivered separately, in accordance with the governance and accountabilities of each of the parties involved. For example, Health Canada inspects the water quality on reserve and CMHC contributes funding for on-reserve housing. Economic development projects and programming from INAC and other federal departments are also linked. Such programs promote First Nation ventures, the success of which is critical to economic development and creating own-source revenues. Provincial and territorial access roads are linked because access to First Nation communities is a vital factor in supporting health and safety as well as successful economic development. INAC respondents believed that collaboration with other government partners was good and that where program delivery is linked on reserve, the potential for meeting CFM Program objectives is enhanced.
4.2 Design Summary of Findings
4.2.1 Clarity of Program Objectives and Outcomes
The evaluation found that CFM Program objectives are clearly stated and understood within the Department and by most First Nation officials. INAC regional officials believed that the main area of misunderstanding by First Nations related to expectations for full versus assisted funding, and differing interpretations of INAC's fiduciary responsibilities in the context of capital funding.
Evidence from the case studies indicates that the majority of First Nations have a clear understanding of the objectives of the program, as well as their roles, responsibilities and accountabilities. This is particularly true for those First Nations with experienced staff. The evaluation found that differing capacity levels play a role in the extent to which CFM objectives are understood by communities, and that some tribal councils have played an important role in improving First Nation understanding of objectives. As well, the evaluation found that rural and remote bands were less likely to have a clear understanding of program objectives.
4.2.2 Priorities and Consistency of National Results
The evaluation confirmed that INAC's NPRF underlies the decision-making process in all regions, and has resulted in a fairly consistent use of program funds for major capital projects over the past several years. The NPRF and capital plans guide the decision-making process within the CFM Program. INAC officials believed that the planning process works well and ensures that appropriate decision making is in line with program objectives. The framework's priorities are:
- Protection of health and safety, and assets (assets require upgrading or replacement to meet appropriate standards);
- Health and safety improvements (upgrades of existing assets, new construction/acquisition projects to mitigate an identified significant risk to health and safety);
- Recapitalization/major maintenance (extend the useful operating life of a facility or asset, or maintain the original service level of the asset); and
- Growth (e.g., anticipated community growth requiring new housing, roads, schools, community buildings).
At the same time, the evaluation found adherence to the NPRF, coupled with budgetary limitations, has resulted in minimal assistance to some lower-priority project categories through the CFM Program. Available funds are insufficient to enable the program to address all priorities within the NPRF. Whereas water projects are given top priority and are well handled within the CFM Program, the evaluation heard evidence that water might not be the highest priority in all communities. Thus, projects such as solid waste management, and roads and bridges may not have received CFM funding.
The evaluation found that the CFM Program is not considered to be a mandatory core program in the same sense as social and education programs. INAC officials indicated that although there is clarity and transparency in targeted funding, regions must satisfy obligations for social and education funding before allocations can be committed to capital projects addressing health and safety priorities.
4.2.3 Design Limitations
Incentives for First Nations to Participate
The evaluation found that a majority of First Nation respondents believed there were appropriate incentives to participate in the program. INAC officials noted that the CFM Program is the primary funding stream for most First Nations to upgrade work and infrastructure and, as such, has nothing to do with incentives. They indicated that the five-year capital plans assist in determining priorities.
The evaluation found that where such incentives differ, it is regarding the source of funding to build the asset in the first place, to maintain the asset according to life cycle materiel management principles, or to correct infrastructure problems. One of the incongruities in the CFM Program design, according to INAC officials, comes in assisting First Nations to properly maintain assets by paying a proportion of the costs, when at the same time the Department will pay 100 percent of costs in an emergency to correct issues relating to the health and safety of a community. In a sense, this rewards communities that do not follow good management practices in dealing with their infrastructure issues and introduces an incentive to let assets deteriorate. Despite this apparent discrepancy in policies, regional officials reported that most First Nations are concerned about health and safety and the quality of life on reserve, and do their best to maintain their infrastructure. As noted earlier, the evaluation found that problems are more likely to arise in those smaller communities that cannot afford a maintenance staff or, more generally, lack the capacity to maintain their infrastructure.
A study commissioned by INAC concluded that 85 percent of Canada's municipal infrastructure is financed through debt, whereas nearly 100 percent of First Nation infrastructure is financed through transfer payments. Voter resistance to higher debt, coupled with taxes and market forces, discipline the size and cost of debt-financed projects. The authors of that study conclude that grants and transfer payments create stronger incentives to overdesign and overbuild. [Note 6]
The evaluation encountered a number of disincentives to program participation from a First Nation perspective. These included cumbersome reporting requirements that were associated with strict penalties.
O&M Funding
The evaluation found major concern among First Nations about the coverage, underlying assumptions and allowable annual increments in O&M funding.
The O&M funding formula takes the following factors into account: the asset quantity in the INAC capital asset inventory information system; the base unit O&M cost in Toronto; the city centre index to adjust for cost variation outside of Toronto; and the remoteness index to account for the proximity of the asset from the nearest service centre where labour, material and services can be obtained. O&M funding is also available to First Nations to subsidize the cost of municipal type agreements and other O&M arrangements with nearby municipalities. [Note 7]
The percentage of overall O&M covered by the CFM Program varies depending on the type of asset that requires maintenance. The underlying premise is that First Nations should be responsible for part of the cost of operating and maintaining a capital asset. A cost-reference manual is used to determine the cost of operating and maintaining assets to generally accepted standards. Although the content of the manual has been updated periodically to account for inflation, it remains rooted in cost structures from the 1980s. A majority of evaluation respondents believed that these structures, which are the bases of the O&M funding formula, were in need of revision and updating.
The maximum allowable annual increase recognized in INAC funding allocations is two percent, which falls below the rate of growth in the actual cost of operating and maintaining capital infrastructure on reserve to a reasonable standard. Saskatchewan First Nations believed the annual gap between their O&M allocation and their estimated gross O&M costs to be, on average, between three and five percent. They noted that the ongoing shortfall leaves them unable to operate and maintain their capital assets to a standard that will maximize the longevity of the infrastructure.
The evaluation noted particular concern with respect to remoteness allowances, which are lagging behind the growth in factors such as labour, materials and transport access. O&M funding shortages are felt most acutely in rural and remote First Nation communities. The evaluation found that many First Nations in such areas have no access to funds to contribute to O&M and ensure sound stewardship of their infrastructure assets.
4.2.4 CFM and Municipal Infrastructure Program Comparability
The evaluation sought feedback on the comparability of the CFM Program design with municipal infrastructure programming. The CFM Program provides access to capital funding to address community priorities in water quality management, wastewater, schools, solid waste disposal, roads and other community buildings, and the CFM Program helps to provide healthy and safe communities for residents. Given that municipalities have the same infrastructure needs as First Nations, the incentives for maintaining assets are similar. Both the CFM Program and municipal infrastructure programs are broadly intended to support safe and healthy community environments.
The evaluation found comparisons of the CFM Program with municipal infrastructure difficult because the funding bases are so different. Municipalities have the power of taxation and can issue bonds whereas First Nations under the Indian Act have not had access to such financing instruments. Municipalities also have the ability to cost-share with provincial/territorial governments. Although the CFM is intended to provide assistance to First Nations for infrastructure needs, many First Nations (especially those located in rural and remote areas) lack sufficient own-source revenue to be able to contribute the expected top up to program funding. As well, very few First Nations charge user fees.
In the literature reviewed for the evaluation, one study pointed to the large differences in capital use profiles of Canadian First Nation and Inuit communities and non-First Nation users of capital. It argues that First Nations are generally reliant upon "non-market sources" because the risk/return ratio or transaction costs make their investment projects unattractive for market sources of capital. Several factors, including the complex regulatory regime and land and resource tenure, result in much higher costs for accessing capital. [Note 8]
4.3 Delivery Summary of Findings
4.3.1 Performance Management Regime
Performance Data
The evaluation found that performance data are neither easily collected nor compiled. Regional data were presented on a band-by-band, project-by-project basis in separate files for each fiscal year.
Prior to 2006, each region maintained a separate database on capital assets on reserve, and kept a paper trail of the status of their asset bases. The logic and clarity among regional reports varied, with the consequence that regional results had limited comparability. All record keeping utilized legacy systems, such as the Housing and Infrastructure Assets web-site and the Capital Asset Management System, which was comprised of the Capital Asset Inventory System (CAIS) [Note 9], Asset Condition Reporting System (ACRS) [Note 10] and the Capital Management Database.
In 2006, INAC implemented the ICMS in an effort to standardize the format and consistency of reporting across the regions. The system began to be functional by the middle of 2008, with the release of ICMS version 3.5. The new system captures similar data to all the previous legacy systems and is geared toward reducing the reporting burden currently placed upon First Nations.
ICMS is an automated system that records information for infrastructure O&M sub-activities. It is used to map O&M funding to First Nations' assets. It contains base level information on capital assets (location of asset, asset type, asset quantity, etc.), housing information (basic community services, housing conditions, water quality, and sewer services) and the results of asset inspections. [Note 11] ICMS also holds site level information on School Facilities and Capital Plans. It is intended to be a tool for managers responsible for the operations, maintenance and construction of capital assets, engineering and costing personnel, personnel responsible for the inventory data collection and maintenance for the system, and tribal councils and First Nations to verify allocations, asset quantity, conditions and needs.
The new system is intended to address criticisms regarding reporting burden that have been in reports from the Auditor General. ICMS also responds to departmental LTCP commitments to improve systems, data tracking and reporting on performance indicators.
Despite these intentions, it appears that funding recipients must continue to complete a number of reports associated with the CFM Program that feed data to the ICMS. INAC's, Recipient Report Guide 2009-2010 lists the following reports to be completed:
- Housing and Infrastructure Asset Report (DCI 460620.FNITP);
- ACRS Projects Annual Report (DCI 460649.FNITP);
- Capital Assets Annual Report (DCI 460642.FNITP);
- Certificate of Completions for Capital Projects (DCI 460671.FNITP) (triggers the ICMS so that O&M funding can begin);
- Five-Year Capital Plan – Annual Update (DCI 460674.FNITP);
- Progress Report on Capital Projects (DCI 460664.FNITP) (as per terms of funding agreement);
- Community-Based Housing Plan – Annual Report (DCI 460665.FNITP); and
- Fire Losses Annual Report (DCI 460611.FNITP).
At this early stage, work continues to iron out the remaining "bugs" in the system. Training is currently being provided to all individuals who will use the system and this process is ongoing. In fact, the commitment to training is noted in a letter from the Deputy Minister of INAC to the Parliamentary Budget Officer, where it is stated that $4.5 million was invested in training and system improvements in the 2009-10 fiscal year alone. [Note 12]
Evaluation findings on the collection and availability of performance data were corroborated during the key informant interviews. Officials commented that performance data and information outcomes are not collected routinely. Reporting is project specific (e.g., meeting codes and standards, satisfying project milestones, updating plans). The evaluation found that asset condition reports and inspections, and five-year capital plans are in place in all regions. Some respondents noted that ACRS reports were being used primarily as compliance documents to trigger funding flows, and the information contained in these reports did not always feed into decision making. Other respondents suggested that ACRS reports did not accurately represent the cost of repairing the capital assets.
Regional officials reported having received some training in using the ICMS, but confirmed that the system was not yet functioning at operational levels. Until ICMS is fully operational and adopted as the formal performance data entry system by INAC, available data are insufficient to provide quantitative evidence on CFM Program delivery performance.
The INAC 2009-10 Performance Measurement Framework lists performance indicators for various infrastructure facilities. Such indicators tend to cluster around percentages of the assets in a category that have completed compliance or inspection reports or percentages of the assets in a particular category meeting required standards. Targets were set for annual growth rates or minimum acceptable level of compliance to be achieved and captured in the ICMS database. The target dates for implementing the desired data collection range from 2009 to 2011, with most being in 2010. [Note 13]
Beginning in 2007-08, DPRs have provided greater reporting on key performance indicators for the Community Infrastructure Program Activity than did earlier reports. Reporting has improved on indicators related to water, wastewater, schools and housing. Performance reporting was more limited for aspects of infrastructure on reserve such as roads, bridges, community buildings and landfills.
During the past two years, DPRs have reported results on the following performance indicators for community infrastructure:
- Percentage of First Nations with community water and wastewater facility maintenance management plans successfully implemented;
- Risk status of community water and wastewater facilities;
- Percentage of certified water and wastewater operators; and
- Percentage of First Nations reported adequate houses for each First Nations community.
Program Monitoring
The evaluation found that major capital is well monitored in the regions. Monitoring of minor capital varies by region and O&M spending is not tracked. The ACRS requires periodic inspections, including an annual update report from First Nations in all regions. Such ACRS reports monitor the condition of assets over a three-to-five year inspection cycle and provide a rough estimate of repair costs for those assets identified as requiring attention. These reports identify O&M needs for specific assets, but do not enable overall monitoring of O&M spending.
Project completion reports, certificates of completion, and supporting documentation are required by the regional offices to confirm completion of the major capital projects. A certificate of substantial completion is required in order for an asset to be entered into the INAC CAIS, and thereby becomes eligible for inclusion in the calculation of the annual O&M assistance to a First Nation. As well, the planning and approval processes for major capital projects are viewed as careful and rigorous.
Some regions require more detail to accompany completion certificates, while others require no more than a signed certificate. The British Columbia (BC) regional office, for example, sometimes asks First Nations to comment on project benefits when they submit completion certificates. Some officials commented that high staff turnover and a general lack of human resources impact on the effectiveness of the monitoring process.
4.3.2 Effectiveness of Program Delivery
Level of O&M Assistance
As mentioned above, the evaluation found that O&M spending is not closely monitored. Differences in funding arrangements make it difficult to track these expenditures. The evaluation encountered no evidence, however, that O&M funding was being used for anything other than the intended purpose. Both INAC regional officials and First Nation officials involved in the case studies and key informant interviews expressed the belief that the level of O&M assistance to support infrastructure assets is insufficient.
The general view of evaluation participants was that O&M budgets would not be diverted when funding already fell short of actual needs. First Nation respondents reported that water treatment and sewage facilities claim the lion's share of O&M costs and they are hard pressed to cover these expenditures. Other pressures on O&M budgets relate to operating community buildings and landfill sites, housing repairs, and road maintenance. First Nation respondents emphasized that O&M funds are used for the intended purpose out of necessity.
Compliance with Program Terms and Conditions
The CFM Program terms and conditions encompass a cluster of authorities that determine eligibility of recipients, the nature of allowable construction and/or acquisition of community capital facilities, and services consistent with approved policies and standards. [Note 14]
Under the 2009-10 program terms and conditions, the maximum amount payable per recipient per year for eligible expenditures without separate Treasury Board approval became $30 million. [Note 15] A review of recipient funding since 2005-06 revealed that no First Nation has exceeded that maximum criterion. In fact, the most funding any First Nation has received under the CFM Program (excluding education expenditures [Note 16]) in any year during that period was $19.7 million.
The terms and conditions also include adherence to INAC's Capital Management Regime to ensure that effective planning processes are in place; risks are effectively identified and managed, the use of assets is maximized and managed on a life-cycle basis; appropriate processes and controls to measure and report on results are in place; sustainable development principles and practices are applied; and that investment decisions align with national priorities.
The INAC regional offices work collaboratively with First Nations to establish and prioritize five-year capital plans according to the CFM Program's NPRF. Projects that mitigate the most urgent health and safety risks receive the highest priority. Adequate operation and maintenance of assets is also important in mitigating health and safety concerns, and ensuring full life cycle of existing and new assets.
Program delivery under the CFM Program must comply with the Department's service standards, Environment Policy and directives and all applicable federal environmental policies, acts, regulations and guidelines. As well, the CFM Program must be delivered in accordance with the Sustainable Development Strategy and support national efforts toward climate change.
The evaluation found there to be adherence to these program terms and conditions. Major capital and targeted programs are tightly controlled by INAC. The extent of INAC's control on minor capital and O&M spending varies in keeping with devolution, block-funding, and multi-year funding arrangements that differ regionally for First Nations. The technical capacity of tribal councils varies across and within the regions. Where tribal councils do not play a major role, the regional office must take on more responsibility.
Operational processes
The evaluation found that key players are seen to be fulfilling their roles, responsibilities, and accountabilities with the governance structure of the CFM Program. First Nations are responsible for preparing project completion reports and frequently rely on their tribal councils to provide technical assistance with such reporting. Regional Investment Management Boards help with decision making on competing priorities. HQ respondents noted that there are well-established systems and manuals in place to guide key players in fulfilling their roles as planned. With decentralized delivery, regions are able to tailor the program to local needs. Regional variations in program delivery are summarized in section 4.3.3 below.
Communication Channels
The evaluation found evidence of weak communication channels between regional offices and First Nations, particularly with respect to the report submission process. First Nation officials commented that they rarely received acknowledgement for reports submitted to regional offices. Stories were recounted of First Nations being required to resubmit reports because the regional office had either misplaced or lost the report. Such instances result in a freeze on funding until reporting requirements are satisfied. Respondents suggested that the poor communication regarding the submission and receipt of reports could be a result of high staff turnover at INAC regional office, a lack of knowledge transfer to new staff, shortage of staff, or delays in implementing electronic, information-technology based solutions.
Timing Issues in the Budget Process
Some First Nation officials believed that the CFM Program's budget process does not adequately reflect the constraints imposed by the limited duration of the construction season, especially in northern communities. They believed that the approval process for funding takes too long and the construction season is well underway before funding begins to flow. For those First Nations without multi-year funding agreements, this can result in uncompleted projects and a loss of funding.
INAC officials pointed to the need to stop the leakage of funds caused by the cash-based approach to funding and would like to have the ability to rollover funds at year end. In the absence of such flexibility, regional officials pointed to the need to streamline the planning and approval processes for project funding.
Risk Management Practices
To the extent that risks are identifiable, they can be anticipated and suitable mitigation strategies can be put in place. INAC officials indicated that the risks are highest for major capital projects. These risks are mitigated to some extent by the level and frequency of project reporting and monitoring involved. Some regional officials would like to move to a risk-based approach for controlling and allocating minor capital and O&M funding.
The BC region has developed and used a comprehensive risk assessment tool (includes both INAC and First Nations). Given very positive feedback, the CFM Program at HQ has modelled its national risk assessment tool on the BC approach.
The evaluation found two broad categories of risk to CFM Program delivery: external events and internal administration. External events, such as unfavourable weather problems, delays in securing regulatory approval or slippage in other planned projects, construction delays or cost overruns, can jeopardize the completion of priority projects. This could result in a budget surplus close to fiscal year end. The mitigation strategy for all such risks most often involves having "shovel-ready" projects available to pull off the shelf and initiated in time to avoid lapsing funds. Evidence from the case studies indicated that First Nations able to take advantage of such "last minute" funding would need in place sufficiently trained and experienced human resources to prepare the requisite documentation.
Internal administrative risks are also perceived to be a serious threat to program delivery. Many of these potential risks relate to high rate of staff turnover at INAC (both at HQ and in the regions). The regional officials interviewed stated that they are constantly trying to fill vacant positions with qualified individuals. First Nation respondents acknowledged the same type of turnover at tribal councils and within community administrations. There is a general shortage of qualified and experienced personnel on reserve. Recent DPRs reported that actions had been initiated to manage aspects of this risk, such as providing training for water operators through the Circuit Rider Program.
4.3.3 Variances in Regional Program Delivery
Although the CFM Program is implemented consistently with respect to the national allocation of funding and the national set of priorities, the evaluation found differences among the regions in the way that the CFM Program is managed and delivered to First Nations.
Each region has an Investment Management Board comprised of senior managers, program officers and, in some cases, First Nation representatives. A majority of respondents indicated that they felt these committees were working as intended with project application and review processes following criteria based on the NPRF. Some respondents suggested that regional directors general might exert influence over which projects get approved. Some First Nation respondents expressed concern over the transparency of the approval process because funding decisions were not always clear. Some regional officials believed that the effectiveness of CFM committees could be improved with more frequent meetings and better quality performance data to support decision making.
The CFM Program is implemented and monitored relatively consistently across the regions for all major capital project investments. Generally, funding for major capital projects is awarded through an application-based process. Manitoba and Saskatchewan have varied approaches due to their adoption of different definitions. Manitoba considers an infrastructure project to be "major" if its cost exceeds one half of the First Nation's core funding allocation. In Saskatchewan, major capital projects include the construction of education facilities or water and sewer projects, and minor capital projects comprise all other projects, including renovations. There is no dollar value threshold to define either.
There is greater variance in the amount of control each region exerts with respect to minor capital and O&M funding that is distributed to First Nations. In some regions, such as the Atlantic, funding is largely allocated on the basis of single and multi-year agreements, which gives First Nations some degree of flexibility in meeting their minor capital and O&M needs out of their allocated budgets. On the other hand, the BC region requires that minor projects be individually approved through an application process. At year end, Quebec will reimburse First Nations for projects paid for by the First Nation rather than lapse any surplus from the region's capital budget. Each region also varies with respect to the use of ACRS, detailed reviews of five-year plans and annual updates, and the nature of consultations and collaboration with First Nation organizations in the region.
Although there is significant variance among the regions with respect to the flow of minor capital, this flexibility enables the regions to deliver the CFM Program in a manner that is best suited to the unique circumstances (history, needs and priorities) of the region. In BC, for example, there are 198 relatively small First Nations, and considerable emphasis is placed on negotiating treaties and land claims settlements. In the Prairie regions, First Nations are spread out geographically – many in the North – with associated special requirements. In the Atlantic, there are a small number of First Nations and limited tribal council involvement. Officials believed that the tailoring of program delivery to the needs of each region supported the achievement of outcomes.
During the evaluation fieldwork, regional capital officials commented that they lacked opportunities to share ideas and good practices with their colleagues from other regions. Since that time, two national meetings have been held, which enable them to communicate and share information in a group setting.
4.4 Success and Impacts Summary of Findings
Appendix A contains a number of tables that were constructed as part of the data review. Reference is made to these tables in order to corroborate findings from other lines of inquiry. Although some of the data may demonstrate infrastructure achievements, caution should be exercised in attributing these to the CFM Program alone.
4.4.1 Achievement of Objectives
Success with Water and Sewer Priorities
The evaluation found that the program has been successful in addressing high priority health and safety concerns related to water and sewer issues. Water projects have been a top priority of the CFM Program over the past five years and consequently, these projects have received significant funding. Considerable progress has been made towards improving the quality of water available to First Nations across the country. First Nation respondents confirmed that they had been supported in dealing with water and sewer issues, and the case studies provided numerous examples of completed water and sewer projects in all regions.
Results from recent DPRs reported in Table 3 indicate improvements in departmental performance indicators related to water and wastewater issues. Increases were observed during the past two years in the percentage of water and wastewater facility maintenance management plans that have been successfully implemented, as well as in the percentage of certified operators.
| Performance Indicator | 2007-2008 | 2008-2009 |
|---|---|---|
|
1Improvement from 2006-07 results were noted but not specified. Source: Departmental Performance Reports for 2007-2008 and 2008-2009. |
||
| Number and (Percentage) of First Nations with Community Water Facility Maintenance Management Plans Successfully Implemented | 137 (18%) | 164 (22%) |
| Number and (Percentage) of First Nations with Community Wastewater Facility Maintenance Management Plans Successfully Implemented | 120 (27%) | 137 (28%) |
| Percentage of Certified Water Operators | 59%1 | 64% |
| Percentage of Certified Wastewater Operators | 30%1 | 47% |
At the same time, a number of community water and wastewater systems continue to be at risk. Table 4 summarizes information on the risk status of these facilities as reported in the last two DPRs. The number of high-risk systems has decreased, thus providing evidence that there has been improvement. The number of medium-risk and low-risk facilities, however, has increased. These data suggest that water and sewer issues will continue to have high priority under the CFM Program.
| Community Facilities | 2006-2007 | 2007-2008 | 2008-2009 |
|---|---|---|---|
| Source: Departmental Performance Reports for 2007-2008 and 2008-2009. | |||
| High-risk Water Systems | 97 | 71 | 48 |
| Medium-risk Water Systems | 355 | 385 | 373 |
| Low-risk Water Systems | 294 | 304 | 341 |
| Total Water System Risks | 743 | 760 | 762 |
| High-risk Wastewater Systems | 67 | 71 | 60 |
| Medium-risk Wastewater Systems | 192 | 196 | 202 |
| Low-risk Wastewater Systems | 223 | 200 | 225 |
| Total Wastewater System Risks | 482 | 467 | 487 |
According to the ARLU data presented in Table A1, water and sewer projects accounted for almost 80 percent of expenditures on major capital infrastructure spending (approximately two thirds of total major capital spending). Within minor capital projects, the balance between spending on community infrastructure and water and sewer projects has shifted towards a relatively larger claim on resources in the former category.
As noted in earlier sections, CFM Program funding is not sufficient to cover all national priority categories and consequently, many capital projects in areas such as housing, roads and bridge construction have received minimal program support because they fall lower on the national priority list. For First Nations that did not have problems related to water, other projects deemed to have high local priority were often delayed.
Data in Table A1 confirmed that roads, electrification and contaminated sites played a less significant role in both major capital and minor projects. Planned spending on roads in 2008-09 was expected to increase significantly, primarily as a result of targeted funding under FNIF.
Almost all respondents reported that O&M funding has not kept pace with the costs. Assets relating to roads and bridges, schools, solid waste disposal, and community buildings may require attention even if they do not pose an immediate threat to health and safety.
Housing
Three key performance indicators for housing and housing servicing in the CFM Performance Measurement Framework are the:
- percent of First Nation reported "adequate" houses per First Nation community;
- percent of houses with water service; and
- percent of houses with sewage service.
Statistics Canada defines an adequate dwelling as one that does not require major repairs and possesses basic plumbing facilities, specifically, hot and cold running water, inside toilet, and installed baths or showers.
As noted earlier, reserve housing was regularly described as the number one priority for many First Nations. Many communities are faced with housing that is overcrowded and does not meet modern day standards.
According to recent DPRs, 72 percent of houses were reported as adequate by First Nations in 2008-09. This was a one percent decrease from the previous year, which reported a slight increase over 2006-07.
ICMS data show recent trends in the quality of on-reserve housing. Because the information in Tables A2 and A3 has been aggregated regionally and nationally, the data provide evidence for this indicator in broad terms only. They do not tell the same story as a community-by-community assessment prior to aggregation would. That being said, the data offer some useful perspectives on the CFM Program's success and performance.
During the period 2004-05 to 2007-08, the number of housing units on reserve increased while on-reserve population remained relatively static. This has resulted in a decline in the average number of people per house from 4.0 to 3.8, which might be considered a positive indicator. During this same period, the number of adequate housing units has also kept pace with the increase in the housing stock, accounting of about 72 percent of total housing throughout the period. Units requiring replacement or major renovation have grown at a comparable rate. The number of units requiring indoor plumbing constitutes a subset of units in need of replacement or major renovation. Here again, a positive trend was observed over the period, where almost 1000 housing units were taken out of that category nationally. The percentage of housing stock that requires indoor plumbing decreased from 4.1 percent in 2004-05 to 2.9 percent in 2007-08.
Considerable variation from region to region can be observed in the data appearing in Table A3. The Prairie regions, Manitoba in particular, had much larger household populations than the other regions and the national 3.8 persons per unit in 2007-08. The percentage of adequate housing stock also varies regionally from a high of 84 percent in Saskatchewan to a low of 56.4 percent in Manitoba, where the percentage of housing units that need indoor plumbing is 9.4 percent or more than three times the national average. Despite this, the Manitoba region managed to decrease the number of houses requiring indoor plumbing by 561 during this period. This improvement was offset by an overall decrease of 923 in Manitoba's stock of adequate on-reserve housing. The Ontario region also made significant headway in reducing the number of units requiring indoor plumbing by 323, while the Atlantic, Quebec, Alberta and Yukon regions added to the number of units in this category. All regions, except Manitoba and the Yukon, increased the number of adequate housing units between 2004-05 and 2007-08.
Table A4 summarizes the number and percentage of on-reserve housing units that do not have either water delivery service or sewage collection service. There is no discernable trend for units without water servicing, although, the increase observed both in number of units and percent of units increased marginally during the past two fiscal years, and this would be seen as a negative performance indicator. Similarly, the 2008 Compendium of INAC Program Datareported a decade (as of 2006-07) of improvements in sewage servicing, although data for 2007-08 indicate a marked increase in units with no sewage collection service.
Table A5 provides a regional breakdown of 2007-08 data. Quebec can be flagged as the only region in which 100 percent of the housing units were reported as having adequate service for both water delivery and sewage collection. The Atlantic, Saskatchewan, BC and Yukon regions also outperform the national average for water servicing, while Ontario and Manitoba have higher-than-average percentages of housing units without water delivery service. In Manitoba, the observed increase over the period in units without water servicing actually occurred in a one-year jump in 2007-08 from the previous year. Ontario and Manitoba have the highest percentage of units without sewage collection services, but have both reduced the total number without service over the past four years. British Columbia, on the other hand, added a significant number of units with no sewage servicing in 2007-08 from what it had recorded in previous years. Overall, the performance results for the adequacy of water and sewage servicing are quite variable across regions.
Electrification and Fire Protection
Other key performance indicators identified in the CFM Performance Measurement Framework are the:
- percent of First Nation communities having access to electricity as per INAC Level of Service Standards (LOSS);
- percent of communities with fire protection; and
- percent of communities with fire protection services that meet INAC LOSS.
Some examples of electrification and fire protection projects were found in the case studies even though these categories were not as high a priority within the CFM Program.
Table A6 summarizes the level of community electrification over the past five years. The number and percentage of communities with electrification did not change significantly over time, with 865 or 89 percent of communities having adequate electrification in 2007-08. The increase in the number of communities in 2005-06 appears to be comprised primarily of new communities with no electrification service. A similar increase in the number of communities in 2007-08 was matched with an increase in the number of communities with adequate electrification. As an indicator of performance, adequate electrification has maintained the status quo.
Table A7 contains data on the number of communities with adequate fire protection. After several years of little change, some improvement was observed in 2007-08, due to marked decreases in the number of communities with inadequate or no fire protection service that year. There is still a need for improvement in this area with little more than half of First Nation communities having adequate fire protection.
4.4.2 Program Challenges and External Influences
Sections 4.2.3 and 4.3.2 address limitations in the design and delivery of the CFM Program. Challenges to program success were associated with the level and tracking of O&M funding, First Nation location and capacity, staff turnover, communication channels and budgetary timing issues. External influences further challenging the program's success include adverse weather conditions and construction interruptions.
This suggests that the CFM Program could be more successful in achieving objectives were it not for such negative influences. The lack of available cost and performance data that challenged the reporting of program success also makes it impossible to measure the impact of these program limitations. The evaluation found limited or no information on minor capital projects and an inability of regions to track O&M expenditures. Furthermore, outcome data are not being collected. This situation is expected to improve once the ICMS is fully functional. The system is intended to centralize the reporting of cost data as well as assist in reporting outcomes. The evaluation found that the ICMS is still in transition and requires greater buy-in from stakeholders in the regions. This will be key to the full implementation of the new Performance Measurement Strategy. [Note 17]
The evaluation found that the discretionary nature of CFM Program funding allows it to be diverted to any shortfalls in the mandatory social and education programs. [Note 18] Such shortfalls usually occur as a result of INAC having to keep pace with provincial funding requirements. INAC officials reported that regional budgets lost access to major capital funding for two years for this reason. In Alberta, for example, it was estimated that half of the regional A-base or $12-14 million was being diverted to social and education programming. Conversely, regional officials in BC reported that CFM funding was not reallocated to other programs. Regional officials emphasized the importance of targeted funding within the CFM Program because targeted programs ensure that the funding cannot be diverted.
While it is reasonable to assume that any diversion of program funds would necessarily have a negative impact on results, the evaluation did not find any data that would allow a quantitative assessment of the magnitude of the impact. Evaluation participants did indicate, however, that such diversions compromise INAC's ability to fund projects that do not fall within the highest priority category.
4.4.3 Cost Leveraging
The evaluation found that cost leveraging does not commonly occur through the CFM Program. Very few First Nations reported that INAC assists them in leveraging additional funds for their infrastructure projects. There are, however, some anecdotal examples of situations in which cost leveraging has been facilitated under the CFM Program. In Alberta, the region has worked collaboratively with the province to support regional water systems, which expedited project completion and led to cost savings for the Department. For the most part, however, the evaluation did not find evidence of this practice in the CFM Program.
The literature in this area has a recurring message: the ability of most First Nations to acquire and maintain infrastructure from own-source revenues is quite limited, but funding infrastructure through transfer payments (grants or contributions) should be complemented by other sources of revenue. The best long-term solution to support and maintain on-reserve infrastructure will likely come through broad-based measures to generate economic development.
Some Success Stories Outside the CFM
There were examples of successful cost leveraging outside the CFM Program. INAC officials in Alberta noted that one vehicle for this could be the province's First Nation Development Fund. The evaluation found examples in Manitoba of cost-sharing initiatives with the province and in Ontario of cost leveraging opportunities made possible by a community's proximity to municipalities that were able to enter agreements to share the costs of servicing and maintenance for facilities and infrastructure agreements, with specific reference to road maintenance and snow removal. The evaluation found other evidence of cost sharing and service agreements between First Nations and nearby cities or towns, particularly for water sewage treatment services.
The evaluation found that cost leveraging is most likely to be successful where the First Nation has steady and reliable access to own source revenue. This factor is seen to be of greater importance than the CFM Program. Another enabling factor is the security of having INAC funding overall, particularly under multi-year funding agreements.
4.5 Cost-Effectiveness/Alternatives Summary of Findings
4.5.1 Cost-Effectiveness
A Lack of Suitable Data
The evaluation was challenged in attempting to secure suitable measures of cost-effectiveness. It was initially anticipated that evidence would be found in administrative and financial databases that would contribute to these issues. In assessing summaries of CFM transfer payments, the evaluation did not encounter information regarding the administrative costs of the program (salaries, overhead, person-years). Moreover, performance data are not reported in a format that would allow an assessment of program cost-effectiveness.
Each region compiles expenditure data on a band-by-band basis for the First Nations receiving funding through the CFM Program. A review of these projects did not encounter any aggregate analyses that would support interregional comparisons.
Some expenditure data were available for small non-First Nation communities. Again, however, the evaluators encountered a major obstacle in the level of detail in reporting and the differences in format and coverage.
The evaluation team considered the possibility of approaching the cost-effectiveness of program expenditures through a comparative analysis of First Nations and non-First Nations with similar geographic and demographic characteristics. For such a purpose, it would be useful to have expenditures on comparable projects (such as, for example, capital expenditures on water or sewer services). It seemed possible, a priori, that useful findings on the relative effectiveness of capital expenditures might be attainable if data were available for First Nation and non-First Nation communities undertaking similar projects. Thus, a sewage capital project undertaken by a non-First Nation community of comparable size and in proximity to a First Nation community might serve as a yardstick for assessing results achieved relative to monies invested.
A review of the municipal capital data found varying levels of detail and inconsistent reporting on the components of capital spending. It also encountered inconsistency among the time frames reported, even among communities in the same province. This would not support a rigorous analysis of cost-effectiveness.
What Data Are Needed
Although data availability varies among the regions, the program would be better served by having access to accurate, consistent and comprehensive administrative data. These could include a listing of all infrastructure assets on reserve, their expected life cycle, their current condition, their asset replacement value, their maintenance project value, deficiencies, and key performance indicators.
Challenges in Measuring Value for Money
As in the case of cost-effectiveness analysis, the evaluation found difficulty in establishing a valid ratio of results achieved to money spent. There is no clear documentation of results, other than the fact that an asset identified as requiring repair, renovation or replacement is repaired or replaced. Such incremental improvements are documented in the annual updates to five-year plans and annual ACRS reports. The cost estimates contained in these documents, however, do not lend themselves to the calculation of a ratio of results achieved to money spent. Regional officials took the position that major capital projects are carefully planned, approved, managed and maintained, and they emphasized that procurement policies are designed to achieve value for money for these projects. [Note 19]
Are There Suitable Proxy Measures?
In the 31 case studies undertaken for the evaluation, there were many examples of critical infrastructure projects (major capital) being initiated and completed in keeping with national priorities. Moreover, the CFM Program requires First Nations to follow competitive procurement policies for major capital projects. The achievement of positive results within these guidelines provides some indication that the projects are achieving value for the money spent.
Moreover, the fact that CFM assistance goes to the highest priority projects (health and safety) means that funding is being directed to areas defined as having the greatest need in terms of program and federal priorities. This is an additional indicator of achieving the best value for money spent.
The evaluation also found evidence to demonstrate that INAC policies seem to be followed to ensure that procurements are competitive. INAC Technical Services professionals review project specifications and design in each region, and such practices add to the argument that the CFM Program is achieving value for money in the planning, design and procurement of major capital projects.
In the absence of hard data, these practices are seen to be enabling the achievement of positive results in the highest priority areas under the constraints of a limited budget. All of these factors appear to give credence to a conclusion that the program has achieved good value for the money spent.
4.5.2 Best Practices
The evaluation identified various good practices that are used in managing and delivering the CFM Program. Three of these are worthy of broader consideration.
First, the evaluation noted particular success through using bank financing to ensure the timely completion of major capital projects. The INAC regional office issues a letter of comfort (non-binding) and this enables the First Nation to secure sufficient funds from its bank to complete an already approved project. The First Nation pays the applicable interest and is then reimbursed by INAC when the funds become available. INAC does not reimburse the interest costs. Even if the INAC funding is spread over more than one fiscal year, it will be applied to the principal of the bank loan.
This practice has proven to be successful in the Quebec region. It has enabled First Nations to complete priority projects more expediently, and also allowed the region to avoid year-end lapses by advancing funding due to the First Nation for an already approved project.
This is an excellent practice, consistent with federal financial regulations, as it allows the funding to be used for the approved priority projects and payments are done for work that has been completed as is required by the financial regulations.
Another best practice observed in several regions was the access of technical support and training available through the Circuit Rider Program. The program provides on-site training several times each year for First Nation water and water distribution operators. Case study participants in the Yukon, Quebec, Alberta and BC regions cited the usefulness of this program in providing access to needed expertise in water management in a cost-effective manner. A number of First Nation respondents commented that their water operators have become certified and that there is interest in expanding the certification program to other capital-related areas.
The third exemplary practice is the BC region's successful and comprehensive risk assessment tool, which has been used by CFM HQ as a model to develop its national risk assessment tool. Since 1993, BC has also used a computerized, in-house project management system, the Capital Project Management System (CPMS). The CPMS holds project information and generates templates for project approvals. The CPMS database tool tracks projects from feasibility to completion, including approvals at each stage, project funding allocations and reporting requirements. Some of its functions are now replicated within the First Nations and Inuit Transfer Payments.
4.5.3 Alternatives and Improvements
The CFM Program could benefit from improvements in the areas of communications, capacity and the timing of funding.
Improving Communication Channels
The evaluation found that communication channels between INAC regional staff and First Nations could be strengthened.
First, routine acknowledgement that reports had been received would help to alert First Nations of problems at an earlier stage so that corrective action could be taken. A timely acknowledgement by fax or email would reassure the First Nation that the paperwork is in order as well as trigger follow-up by the First Nation. Having funding frozen for the lack of a report that the First Nation has in fact submitted can impose unnecessary constraints on budget management and project implementation.
Second, First Nations could attempt to ensure that communications from the regional office reach the responsible manager within their administration. If managers are going to be absent, personnel should be appointed to cover their files. The evaluation found evidence of communications from INAC directed to the Chief or band manager, which was left sitting on their desks until their return. Management inefficiencies result when communications cannot be acted on in a timely manner.
Third, greater transparency would help First Nation stakeholders understand and be informed about the reasons for decisions in the project application process. Clearer explanations of decisions would enable applicants to learn from shortcomings identified in their proposals and greater transparency would enhance the degree of trust between the parties involved.
Increasing Capacity
The evaluation found that there is need to support capacity development within First Nation administrations through management training and strengthening technical skills.
Many First Nations lack in-house skills in project management and technical services and have expressed a desire to acquire such skills through training. To this end, case study participants saw merit in expanding the scope of expertise under the Circuit Rider Program to areas of O&M beyond water management. The evaluation found examples of funding being diverted to consultants via project out-sourcing due to a lack of resident expertise on reserve.
In addition to a need for more training in technical areas, there is a need to create incentives to keep trained technicians working for smaller First Nations that are not able to provide salaries, which commensurate with their level of training. Technical skills can be acquired through training programs such as the Circuit Rider Program. Once trained, however, technicians have minimal economic incentives to remain in the community.
Improved Timing
The evaluation found general consensus that program delivery could be improved if multi-year funding were more widely available. This would help to address project management issues related to short construction seasons and avoid year-end practices that have involved spending on lower priority projects that were "shovel-ready". Multi-year funding would have the advantage of allowing better planning to address the highest priorities. Benefits could also be achieved through greater attention to speeding up approval processes prior to the beginning of each construction season.
As well, there is strong support to see funds flow prior to the beginning of the construction season. More widespread use of letters of comfort and then reimbursing the First Nation for the cost of an approved project over time could be one strategy to address this issue.
5. Findings, Conclusions and Recommendations
5.1 Findings/Conclusions
The evaluation confirmed the relevance of the CFM Program and its alignment with both INAC and federal priorities and objectives. The CFM Program makes an important contribution to First Nations through assisting them to acquire, operate and maintain basic infrastructure. It supports First Nations in establishing safe, healthy and sustainable communities. Without CFM funding, many infrastructure-related projects would not be possible.
Roles, responsibilities, and terminology are generally well understood, especially among experienced First Nation and INAC program officials. The decision-making process for funding allocations aligns with national priorities in all regions. All regions use the NPRF as a guide for making decisions with respect to funding allocations. An exception was noted where some regions allocate surplus funds at fiscal year-end to projects that can be completed quickly and which may not fall into the highest priority categories.
The CFM Program was seen to be achieving its top priorities, but the availability of funding for lower priority issues has been limited. Significant progress has been made in achieving the top priority for access to drinking water that meets current safety standards. The CFM Program has also supported wastewater projects in recent years. First Nation evaluation participants acknowledged the importance of dealing with these priority areas, but also ranked housing high or highest among their own community infrastructure priorities.
The allocation of major capital funding is similar throughout most regions. Each region varies, however, with respect to how it delivers the O&M and minor capital components of the program. Success of the program does not seem to be linked with the method of program delivery. Rather, other factors such as the First Nation community's proximity to an urban centre, expertise and involvement from the tribal council, and its ability to generate own-source revenue, all impact the performance of the CFM Program.
All regions monitor projects to varying degrees but performance measures are limited. Monitoring of major capital appears to be adequate in all regions, but there is little consistency in the monitoring of minor capital projects and O&M funding. There is an opportunity for significant improvement regarding the measurement of outcome indicators once the ICMS is fully implemented in the regions. The Department continues to work toward removing any system problems and is committed to training users in using this new system to record, monitor and report on the spending on and condition of their assets in their regional inventories.
Across the country, First Nation and INAC officials were concerned that O&M funding is often insufficient. Concerns were also raised about the formula used to calculate O&M, the allowable annual increments and the fact that cost reference manuals were outdated and do not reflect adequately the costs borne by rural and remote communities. As well, First Nations desire improved transparency regarding the funding allocation process and better alignment between the timing of the funding approval process and the construction season.
There is room for improvement in certain areas such as communications between First Nations and regional offices, and in the timeliness of project funding. High staff turnover and weak knowledge transfer were blamed for communication breakdowns. The case studies found some best regional practices that might help in the area of timing. In Quebec, the region has issued non-binding letters of comfort to banks that in turn will lend money to First Nations with approved projects. When the INAC funds become available, the First Nations recipient is able to repay the bank loan. This has enabled projects to be completed within the fiscal year and avoid unnecessary delays that have occurred elsewhere.
Data were insufficient to enable a quantitative assessment of results achieved relative to money spent. On the other hand, given the fact that major capital projects are being carried out in line with national priorities and that achievements are being observed within competitive procurement guidelines, it does appear that there is value for money. As well, the association of CFM funding with the highest priority health and safety projects means that the money is being spent in areas of greatest need nationally.
5.2 Recommendations
- The CFM program should be renewed on the basis of demonstrated relevance, accomplishments, ongoing need, and First Nation priorities.
- INAC, in consultation with First Nations and tribal councils, should revisit and modernize the formula underlying O&M funding to ensure it reflects current day realities and cost structures, and creates incentives for adequate maintenance of community infrastructure.
- INAC should improve cost and performance measures related to infrastructure (financial and non-financial information).
-
INAC and First Nations should work together, in consultation with tribal councils, to:
- improve the timeliness of communications at the regional level; and
- integrate reporting requirements (including performance measures).
-
INAC and First Nations should pursue those practices identified by the evaluation as demonstrating good management and effective delivery. These include, but are not limited to:
- Letters of comfort to secure bank financing on the basis of project approval, in order to avoid unnecessary delays in project implementation;
- Improved training in project management and technical areas to augment the skill base within First Nation administrations, which will enable those First Nations to reduce their expenditures on outside consultants and speed up their project application processes, and expand the certification elements of the Circuit Rider Program to other capital-related areas; and
- Provide funding on a multi-year basis and/or re-profile funding to compensate for construction delays.
Appendix A - Data
| Capital Facilities and Maintenance | 2003-2004 | 2004-2005 | 2005-2006 | 2006-2007 | 2007-2008 Planned | 2008-2009 Planned |
|---|---|---|---|---|---|---|
| Source: Calculated from ARLU data. | ||||||
| Major Capital Projects | ||||||
| Community Infrastructure | 2.2% | 5.5% | 8.7% | 9.5% | 7.6% | 8.0% |
| Water and Sewer | 55.9% | 48.2% | 50.6% | 55.5% | 47.7% | 50.6% |
| Roads | 2.4% | 2.9% | 4.3% | 1.7% | 1.6% | 5.5% |
| Electrification | 2.5% | 3.9% | 1.0% | 2.1% | 3.0% | 4.2% |
| Contaminated Sites | 1.1% | 0.1% | 0.4% | 0.7% | 1.4% | 0.8% |
| Total Infrastructure | 64.1% | 60.7% | 65.0% | 69.6% | 61.4% | 69.0% |
| Education | 32.9% | 37.1% | 28.6% | 25.3% | 32.0% | 29.8% |
| Housing | 3.0% | 2.2% | 6.4% | 5.2% | 6.6% | 1.2% |
| Total Major Capital | 100.0% | 100.0% | 100.0% | 100.0% | 100.0% | 100.0% |
| Minor Capital Projects | ||||||
| Community Infrastructure | 25.1% | 25.1% | 27.4% | 21.1% | 28.0% | 17.7% |
| Water and Sewer | 24.8% | 24.1% | 20.6% | 13.2% | 19.8% | 17.0% |
| Roads | 4.6% | 4.4% | 5.2% | 3.1% | 3.1% | 13.6% |
| Electrification | 1.3% | 1.0% | 1.3% | 1.2% | 1.5% | 0.2% |
| Contaminated Sites | 0.7% | 2.7% | 2.6% | 2.2% | 3.6% | 3.1% |
| Total Infrastructure | 56.5% | 57.3% | 57.1% | 40.9% | 55.9% | 51.6% |
| Education | 8.1% | 4.8% | 4.4% | 5.1% | 11.7% | 14.3% |
| Housing | 35.4% | 37.9% | 38.4% | 53.9% | 32.4% | 34.1% |
| Total Minor Capital | 100.0% | 100.0% | 100.0% | 100.0% | 100.0% | 100.0% |
| CFM - O&M | ||||||
| Community Infrastructure | 20.0% | |||||
| Water and Sewer | 33.9% | |||||
| Roads | 11.6% | |||||
| Electrification | 2.9% | |||||
| Contaminated Sites | 0.0% | |||||
| Infrastructure | 71.6% | 72.7% | 71.2% | 73.5% | 73.7% | 68.5% |
| Education | 27.4% | 26.3% | 27.8% | 25.5% | 25.3% | 30.3% |
| Housing | 1.0% | 1.0% | 1.1% | 1.0% | 0.9% | 1.1% |
| Total O&M | 100.0% | 100.0% | 100.0% | 100.0% | 100.0% | 100.0% |
Housing
| 2004-20051 | 2005-2006 | 2006-2007 | 2007-2008 | |
|---|---|---|---|---|
|
1 In 2004/2005, The information collected through the Housing and Infrastructure Assets Annual report was revised in an effort to allow better comparison of First Nations housing conditions with the rest of Canada. The purpose of the revision was to align the housing definitions with the definitions used by Statistics Canada. For this reason, 2003/2004 data are not presented in this table. 2 Housing units that require replacement are units that are no longer habitable (e.g., as a result of fires or natural disasters); or have been declared unsafe or unfit for human habitation by a certified inspector because they no longer meet basic quality standards and cannot be economically renovated to an acceptable condition. 3 Houses that need major renovations could include, but are not limited to: extensive structural faults such as rotting or sagging foundations; extensive structural repairs to walls, floors, ceilings or roofs; and, replacement and/or upgrading of defective plumbing and/or electrical wiring. 4 Basic indoor plumbing facilities include inside toilets, hot and cold running water and installed baths or showers. 5 Defined as a dwelling that possesses basic indoor plumbing facilities and does not require major renovations or replacement |
||||
| Population | 386,807 | 392,779 | 392,776 | 387,288 |
| Total Housing Units | 96,804 | 97,992 | 99,939 | 102,190 |
| Population per Housing Unit | 4.0 | 4.0 | 3.9 | 3.8 |
| Units that Need Replacement2 | 5,519 | 5,746 | 5,609 | 5,723 |
| 5.7% | 5.9% | 5.6% | 5.6% | |
| Units that Need Major Renovations3 | 21,197 | 21,566 | 21,832 | 23,265 |
| 21.9% | 22.0% | 21.8% | 22.8% | |
| Units that Need Indoor Plumbing4 | 3,955 | 3,351 | 2,993 | 3,000 |
| 4.1% | 3.4% | 3.0% | 2.9% | |
| Adequate5 | 70,088 | 70,680 | 72,498 | 73,202 |
| 72.4% | 72.1% | 72.5% | 71.6% | |
| Source: ICMS, Housing and Assets Inventory Regional Summaries | Atlantic | Quebec | Ontario | Manitoba | Sask. | Alberta | B.C. | Yukon |
|---|---|---|---|---|---|---|---|---|
| Population | 18,679 | 34,076 | 80,659 | 74,296 | 59,072 | 61,545 | 57,721 | 1,240 |
| Total Housing Units | 6,494 | 9,721 | 23,278 | 15,499 | 13,361 | 14,543 | 18,720 | 574 |
| Population per Housing Unit | 2.9 | 3.5 | 3.5 | 4.8 | 4.4 | 4.2 | 3.1 | 2.2 |
| Units that Need Replacement1 | 237 | 136 | 1,401 | 1,346 | 213 | 1,135 | 1,229 | 26 |
| 3.6% | 1.4% | 6.0% | 8.7% | 1.6% | 7.8% | 6.6% | 4.5% | |
| Units that Need Major Renovations2 | 1,042 | 1,283 | 4,475 | 5,416 | 5,416 | 4,851 | 4,176 | 94 |
| 16.0% | 13.2% | 19.2% | 34.9% | 14.4% | 33.4% | 22.3% | 16.4% | |
| Adequate3 | 5,215 | 8,302 | 17,402 | 8,737 | 11,220 | 8,557 | 13,315 | 454 |
| 80.3% | 85.4% | 74.8% | 56.4% | 84.0% | 58.8% | 71.1% | 79.1% | |
| Increase (Decrease) in the Number of Adequate Units between 2004/05 and 2007/08 |
320 | 525 | 900 | -923 | 775 | 969 | 561 | -13 |
| Units that Need Indoor Plumbing4 | 56 | 11 | 661 | 1,463 | 94 | 431 | 271 | 13 |
| 0.9% | 0.1% | 2.8% | 9.4% | 0.7% | 3.0% | 1.4% | 2.3% | |
| Increase (Decrease) in the Number of that Need Indoor Plumbing from 2004/05 to 2007/08 | 27 | 10 | -385 | -569 | -31 | 39 | -50 | 4 |
1 Housing units that require replacement are units that are no longer habitable (e.g., as a result of fires or natural disasters); or have been declared unsafe or unfit for human habitation by a certified inspector because they no longer meet basic quality standards and cannot be economically renovated to an acceptable condition.
2 Houses that need major renovations could include, but is not limited to: extensive structural faults such as rotting or sagging foundations; extensive structural repairs to walls, floors, ceilings or roofs; and, replacement and/or upgrading of defective plumbing and/or electrical wiring.
3 Basic indoor plumbing facilities include inside toilets, hot and cold running water and installed baths or showers.
4 Defined as a dwelling that possesses basic indoor plumbing facilities and does not require major renovations or replacement
Source: ICMS, Housing and Assets Inventory Regional Summaries
| 2004-2005 | 2005-2006 | 2006-2007 | 2007-20083 | |
|---|---|---|---|---|
|
1Water Servicing includes the following modes of water delivery: Community System, Individual System, Truck Water A and Truck Water B. In 2004/05, the definition of Truck Water B was revised. 2Sewage Servicing includes piped and truck sewage collection. 3During HQ verification, discrepancies were identified in Alberta region's data. This table will be updated once the discrepancies are resolved. Sources: Compendium of INAC Program Data, 2008 and ICMS, Water Servicing and Sewage Servicing Regional Summaries |
||||
| Total Housing Units | 96,804 | 97,992 | 99,939 | 102,190 |
| Units with No Water Servicing1 | 1,640 | 1,609 | 1,722 | 2,204 |
| 1.7% | 1.6% | 1.7% | 2.2% | |
| Units With No Sewage Servicing2 | 3,990 | 3,745 | 3,267 | 3,793 |
| 3.9% | 3.3% | 3.7% | 3.9% | |
| Region | Atlantic | Quebec | Ontario | Manitoba | Sask. | Alberta3 | B.C. | Yukon |
|---|---|---|---|---|---|---|---|---|
| Total Housing Units | 6,494 | 9,721 | 23,278 | 15,499 | 13,361 | 14,543 | 18,720 | 574 |
| Units with No Water Servicing1 | 17 | 0 | 1024 | 521 | 46 | 430 | 162 | 4 |
| 0.3% | 0.0% | 4.4% | 3.4% | 0.3% | 3.0% | 0.9% | 0.7% | |
| Increase (Decrease) in No Water Service between 2004/05 and 2007/08 | -2 | 0 | 7 | 423 | 6 | 69 | 63 | -2 |
| Units With No Sewage Servicing2 | 17 | 0 | 1,164 | 1,356 | 92 | 428 | 732 | 4 |
| 0.3% | 0.0% | 5.0% | 8.7% | 0.7% | 2.9% | 3.9% | 0.7% | |
| Increase (Decrease) in No Sewage Service between 2004/05 and 2007/08 | -2 | 0 | -106 | -659 | -26 | -3 | 601 | -2 |
1Water Servicing includes the following modes of water delivery: Community System, Individual System, Truck Water A and Truck Water B. In 2004/05, the definition of Truck Water B was revised.
2Sewage Servicing includes piped and truck sewage collection.
3During HQ verification, discrepancies were identified in Alberta region's data. In the 2008/2009, the discrepancy between the information collected through the Housing and Infrastructure Assets Annual Report and the Sewage Service - Mode of Sewage Collection section of the Housing Module in ICMS has been corrected. The Housing Module in ICMS has been revised to reflect the reporting requirements identified in the Recipient Reporting Guide and now facilitates the capture of Piped Individual and Piped Community sewage servicing.
Source: ICMS, Water Servicing and Sewage Servicing Regional Summaries
Community Services
| 2003-2004 | 2004-2005 | 2005-2006 | 2006-2007 | 2007-2008 | |
|---|---|---|---|---|---|
|
1 Adequate electrification includes service provided to the community by: Grid: Diesel Generated, Full Service; and Other Generated, Full Service. 2 Inadequate electrification includes service provided to the community by Diesel Generated, Restricted Service and Other Generated, Restricted Service Source: Compendium of INAC Program Data, 2008 |
|||||
| Number of Communities | 964 | 963 | 970 | 970 | 976 |
| Adequate Electrification1 | 855 | 854 | 855 | 858 | 865 |
| 88.7% | 88.7% | 88.1% | 88.5% | 88.6% | |
| Inadequate Electrification2 | 19 | 20 | 21 | 19 | 18 |
| 2.0% | 2.1% | 2.2% | 2.0% | 1.8% | |
| No Electrification Service | 90 | 89 | 94 | 93 | 93 |
| 9.3% | 9.2% | 9.7% | 9.6% | 9.5% | |
| 2003-2004 | 2004-2005 | 2005-2006 | 2006-2007 | 2007-2008 | |
|---|---|---|---|---|---|
|
1A dequate fire protection is defined as service that is verified by a site survey conducted by a fire protection specialist and either: meets LOSS - Fire Protection (INAC Corporate Manuals System, Vol. 1, Part 1-1, Appendix A) and is provided with a staffed and trained fire department; or ahs a substitute mutual aide or Municipal Type Agreement to provide the required material and staff. 2 Inadequate fire protection is defined as service that is not verified by a site survey conducted by a fire protection specialist; and/or does not provide a staffed and trained fire department; and/or does not have a mutual aid or Municipal Type Agreement to provide the require material and staff. Source: Compendium of INAC Program Data, 2008 |
|||||
| Number of Communities | 964 | 963 | 970 | 970 | 976 |
| Adequate Fire Protection1 | 529 | 531 | 533 | 516 | 554 |
| 54.9% | 55.1% | 54.9% | 53.2% | 56.8% | |
| Inadequate Fire Protection2 | 173 | 168 | 167 | 184 | 170 |
| 17.9% | 17.4% | 17.2% | 19.0% | 17.4% | |
| No Fire Protection Service | 262 | 264 | 270 | 270 | 252 |
| 27.2% | 27.4% | 27.8% | 27.8% | 25.8% | |
Footnotes:
- Individuals from the following areas participated in interviews: Community Infrastructure Branch, Innovation and Partnerships Directorate, Policy Directorate, Operations and Implementation Directorate, Operations and Planning Support Branch, Programs and Procedures Directorate.(return to source paragraph)
- The Government of Canada invested $295 million over five years to help stabilize on-reserve housing in budget 2005.(return to source paragraph)
- Budget 2006 provided $47.4 million for schools and budget 2005 provided $192 million for housing(return to source paragraph)
- These expenditures are indicated as planned due to a change in process for capital planning. (return to source paragraph)
- Australian Bureau of Statistics and Housing New Zealand Corporation, various studies and strategic plans on the subject of Indigenous housing, 2001 and 2007.(return to source paragraph)
- JANAM Group, Problems Associates with Overbuilding and Overdesign in Non-First Nation Communities, INAC, 2005.(return to source paragraph)
- INAC Corporate Manuals System. Amend./Modif. 4 98.03.31; Chapter 1-2, Appendix C, O&M Finding, page 2, paragraph 5.3.(return to source paragraph)
- Dr. Dominique Collin and Michael Rice, Access to Capital for Business: Scoping Out the First Nation and Inuit Challenge, Presentation at the Statistics Canada Socio-economic Conference, May 4, 2009. (return to source paragraph)
- CAIS is a computerized system designed to accept, aggregate and report base level information on on-reserve capital assets as well as provide a summary of this information to Headquarters, regions, districts, First Nations and Tribal Council Technical Units. The information in CAIS is also used for calculating the annual O&M gross and net funding requirements for the community infrastructure capital assets.(return to source paragraph)
- ACRS is a system module of the CAIS. The information contained in ACRS includes an assessment of the condition of on reserve, O&M funded assets. The system also provides information and cost estimates for repair and reconstruction needs, and an estimate of the remaining life of the asset.(return to source paragraph)
- First Nations may record non-INAC-funded assets in their inventory, but these will not link into INAC O&M funding.(return to source paragraph)
- Letter from Deputy Minister Michael Wernick to Kevin Page on June 19, 2009. The letter was written to correct factual inaccuracies in a Library of Parliament report entitled The Funding Requirement for First Nations Schools in Canada.(return to source paragraph)
- INAC, Excel Worksheet, PMF 2009-2010, INAC PMF for TBS - Oct 15, 2008. (return to source paragraph)
- The terms and conditions of the CFM Program are listed in Annex C of the Capital Facilities and Maintenance Program Management Control Framework dated April 1, 2009. (return to source paragraph)
- During the period under evaluation, the maximum allowed was specified at $15 million per project. (return to source paragraph)
- Education expenditures were not available at the time of the review.(return to source paragraph)
- INAC, Community Infrastructure Branch, Capital Facilities and Maintenance Program and First Nations Infrastructure Fund Performance Management Strategy, November 2009.(return to source paragraph)
- According to one HQ official, an internal report prepared at INAC HQ suggested that approximately ten percent of the CFM national annual allocation is being diverted to meet the mandatory funding needs under education and social. (return to source paragraph)
- Regional expenditure data were not provided to the evaluation team to allow a more thorough analysis.(return to source paragraph)